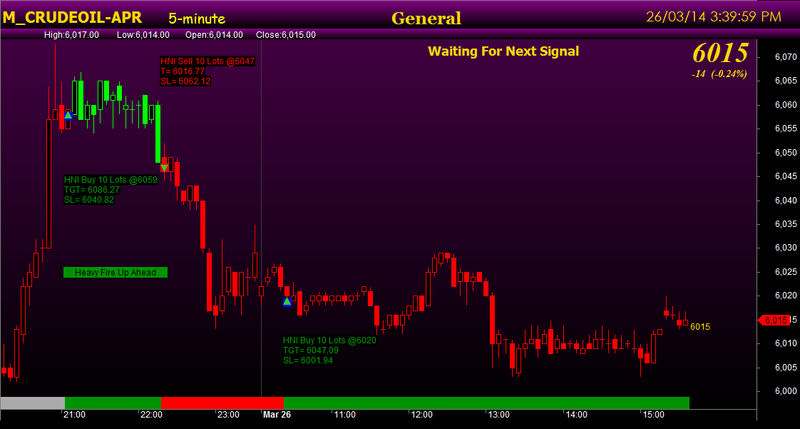
Future Mode Indicator for Amibroker (AFL)
Santhosh sivan over 12 years ago Amibroker (AFL)
This indicator is shared by one of my friend and request you friends to try this and give your valuable feedback.
Signals will be generated in future mode. But need not to worry those. What we do is simply workout the given levels.
Thats it.
TF is 5 minutes.
Screenshots
Indicator / Formula
Copy & Paste Friendly
_SECTION_BEGIN("HA");


tchoice=Param("Title Selection ",2,1,2,1);

Q=Param("% Change",2.1,1,10,1);
Z= Ref(Zig(C ,q ),-1) ;
HH=Ref(((Z<Ref(Z,-1) AND Ref(Z,-1) > Ref(Z,-2)) AND (Peak(z,q,1 ) >Peak(Z,q,2))),-1);
LH=Ref(((Z<Ref(Z,-1) AND Ref(Z,-1) > Ref(Z,-2)) AND (Peak(Z,q,1 ) <Peak(Z,q,2))),-1);
HL=Ref(((Z>Ref(Z,-1) AND Ref(Z,-1) < Ref(Z,-2)) AND (Trough(Z,q,1 ) >Trough(Z,q,2))),-1);
LL=Ref(((Z>Ref(Z,-1) AND Ref(Z,-1) < Ref(Z,-2)) AND (Trough(Z,q,1 ) <Trough(Z,q,2))),-1);
GraphXSpace = 5;
dist = 0.5*ATR(20);

for( i = 0; i < BarCount; i++ )
{
if( HH[i] ) PlotText( "HH", i, H[ i ]+dist[i], colorCustom12 );
if( LH[i] ) PlotText( "LH", i, H[ i ]+dist[i], colorCustom12 );
if( HL[i] ) PlotText( "HL", i, L[ i ]-dist[i], colorBlack );
if( LL[i] ) PlotText( "LL", i, L[ i ]-dist[i], colorBlack );

}

//calculates floor pivots from previous days data & plots it on the present intraday chart.
//RED LINE = RESISTANCE
//RED DASHED LINE = MINI RESISTANCE
//BLUE LINE = SUPPORT
//BLUE DASHED LINE = MINI SUPPORT
//YELLOW DOTTED LINE = PIVOT
//RED DOTTED LINE = PREVIOUS Day High
//BLUE DOTTED LINE = PREVIOUS Day Low
//BLACK DOTTED LINE = PREVIOUS Day Close


//2 - IN - 1 PRICE CHART
Pstyle = ParamToggle("Heikin Ashi","On|Off",1);
if(Pstyle==0){
HaClose = (O+H+L+C)/4;
HaOpen = AMA( Ref( HaClose, -1 ), 0.5 );
HaHigh = Max( H, Max( HaClose, HaOpen ) );
HaLow = Min( L, Min( HaClose, HaOpen ) );
//PlotOHLC(HaOpen,HaHigh,HaLow,HaClose,"",IIf(HaClose > HaOpen,colorGreen,colorBrown),styleCandle);

//Sell = (abs(HaOpen -HaClose )<= ((HaHigh -HaLow )*0.1));
//Buy = (abs(HaOpen -HaClose )<= ((HaHigh -HaLow )*0.1)) ;

Buy = ExRem( Buy, Sell );
Sell = ExRem( Sell, Buy );

//PlotShapes( IIf( Sell, shapeDownArrow+ shapePositionAbove, shapeNone), colorCustom12 );
//Plot(EMA(HaClose,20), "", colorBlue , styleLine|styleThick );
//Plot(Wilders(H,260.6), "",colorCustom12 , styleDashed|styleThick );
//Plot(EMA(HaClose,10), "",colorTan, styleLine|styleThick );


TimeFrameSet(inHourly);
Hh=HHV (L,24);
Ll =LLV (H,24);
TimeFrameRestore();
Hh1=(TimeFrameExpand( Hh, inHourly));
Ll1=(TimeFrameExpand( Ll, inHourly));

Plot(Hh1 , "27dayssellbelclose",colorRed, 4+8+2048);
Plot(Ll1 , "27daysbuyabvclose",colorGreen, 4+8+2048);

Buy=Cross(C,LL);
Sell=Cross(HH,C);
Filter=Buy OR Sell;


_N(Title = StrFormat("{{NAME}} - {{INTERVAL}} {{DATE}} Open %g, Hi %g, Lo %g, Close %g (%.1f%%) {{VALUES}}", O, H, L, C, SelectedValue( ROC( C, 1 ) ) ));
Plot( C, "Close", ParamColor("Color", colorBlack ), styleNoTitle | ParamStyle("Style") | GetPriceStyle() );
}


Pivot = ParamToggle("Pivot", "weekly|monthly", 1);

if(Pivot)
{
H1 = TimeFrameGetPrice("H", inMonthly, -1); // yesterdays high
L1 = TimeFrameGetPrice("L", inMonthly, -1); // low
C1= TimeFrameGetPrice("C", inMonthly, -1); // close


}
else
{
H1 = TimeFrameGetPrice("H", inWeekly, -1); // yesterdays high
L1 = TimeFrameGetPrice("L", inWeekly, -1); // low
C1= TimeFrameGetPrice("C", inWeekly, -1); // close
}

// PIVOT Calculation
P = ( H1+ L1+ C1 )/3;
R1 = P+(H1-L1)/2-(P-C1)/2;
R2 = H1-L1+P;
R3 = H1-L1+R1;
R4 = H1-L1+R2;
R5 = H1-L1+R3;
R6 = H1-L1+R4;
R7 = H1-L1+R5;
R8 = H1-L1+R6;
R9 = H1-L1+R7;
R10 = H1-L1+R8;


S1 = P -(H1-L1)/2-(P-C1)/2;
S2 = P -(H1-L1);
S3 = S1 -(H1-L1);
S4 = S2 -(H1-L1);
S5 = S3 -(H1-L1);
S6 = S4 -(H1-L1);
S7 = S5 -(H1-L1);
S8 = S6 -(H1-L1);
S9 = S7 -(H1-L1);
S10 =S8 -(H1-L1);


// PIVOT mid points
MIDR1 = (P+R1)/2;
MIDR2 = (R1+R2)/2;
MIDR3 = (R2+R3)/2;
MIDR4 = (R3+R4)/2;
MIDR5 = (R4+R5)/2;
MIDR6 = (R5+R6)/2;
MIDR7 = (R6+R7)/2;
MIDR8 = (R7+R8)/2;
MIDR9 = (R8+R9)/2;
MIDR10 = (R9+R10)/2;


MIDS1 = (P+S1)/2;
MIDS2 = (S1+S2)/2;
MIDS3 = (S2+S3)/2;
MIDS4 = (S3+S4)/2;
MIDS5 = (S4+S5)/2;
MIDS6 = (S5+S6)/2;
MIDS7 = (S6+S7)/2;
MIDS8 = (S7+S8)/2;
MIDS9 = (S8+S9)/2;
MIDS10 = (S9+S10)/2;


n=130;
per =11.5;
x = Cum(1);
s1=IIf(RSIa(L,n)>Min(RSIa(C,n),RSIa(O,n)),Min(RSIa (C,n),RSIa(O,n)),RSIa(L,n));
s11=IIf(RSIa(H,n)<Max(RSIa(C,n),RSIa(O,n)),Max(RSIa(C,n),RSIa(O,n)),RSIa(H,n));
pS = TroughBars( s1, per, 1 ) == 0;
endt= LastValue(ValueWhen( pS, x, 1 ));
startt=LastValue(ValueWhen( pS, x, 2 ));
dtS =endt-startt;
endS = LastValue(ValueWhen( pS, s1, 1 ) );
startS = LastValue( ValueWhen( pS, s1, 2 ));
aS = (endS-startS)/dtS;bS = endS;
trendlineS = aS * ( x -endt ) + bS;
pR = PeakBars( s11, per, 1 ) == 0;
endt1= LastValue(ValueWhen( pR, x, 1 ));
startt1=LastValue(ValueWhen( pR, x, 2 ));
dtR =endt1-startt1;
endR = LastValue(ValueWhen( pR, s11, 1 ) );
startR = LastValue( ValueWhen( pR, s11, 2 ));
aR = (endR-startR)/dtR;
bR = endR;
trendlineR = aR * ( x -endt1 ) + bR;
//Plot(ValueWhen( (S1==trendlineS ), L),"", colorGreen, styleDashed|styleNoRescale|styleThick);
//Plot(ValueWhen((S11==trendlineR ), H),"", colorRed, styleDashed|styleNoRescale|styleThick);
Buy = Ref(Ref(Ref(Ref(Ref(Ref(Ref(Ref(Ref(Ref(Ref(S1==trendlineS,-1),-1),-1),-1),-1),-1),-1),-1),-1),-1),-1);
Sell = Ref(Ref(Ref(Ref(Ref(Ref(Ref(Ref(Ref(Ref(Ref(Ref(Ref(Ref(Ref(Ref(Ref(S11==trendlineR,-1 ),-1),-1),-1),-1),-1),-1),-1),-1),-1),-1),-1),-1 ),-1 ),-1 ),-1 ),-1 );
Buy = ExRem( Buy, Sell );
Sell = ExRem( Sell, Buy );
AlertIf( Buy, "", "BUY @ " + C, 1 );
AlertIf( Sell, "", "SELL @ " + C, 2 );
//PlotShapes( Buy * shapeUpArrow + Sell * shapeDownArrow, IIf( Buy, colorGold, colorPink) );
dist = 2.5*ATR(10);
dist1 = 0.7*ATR(10);
for( i = 0; i < BarCount; i++ )
{
 if( Buy[i] )
 {
  PlotText( "\n     Heavy Fire Up Ahead     "  , i, L[ i ]-dist[i], colorBlack, colorGreen );
  //Say("Heavy Fire Up Ahead");
 }
 if( Sell[i] )
 {
  PlotText( "     Heavy Down Fall Ahead     "  , i, H[ i ]+dist1[i], colorBlack, colorRed );
  //Say("Heavy Down Fall Ahead");
 }
}

n=45;
per =20;
x = Cum(1);
s1=IIf(RSIa(L,n)>Min(RSIa(C,n),RSIa(O,n)),Min(RSIa (C,n),RSIa(O,n)),RSIa(L,n));
s11=IIf(RSIa(H,n)<Max(RSIa(C,n),RSIa(O,n)),Max(RSIa(C,n),RSIa(O,n)),RSIa(H,n));
pS = TroughBars( s1, per, 1 ) == 0;
endt= LastValue(ValueWhen( pS, x, 1 ));
startt=LastValue(ValueWhen( pS, x, 2 ));
dtS =endt-startt;
endS = LastValue(ValueWhen( pS, s1, 1 ) );
startS = LastValue( ValueWhen( pS, s1, 2 ));
aS = (endS-startS)/dtS;bS = endS;
trendlineS = aS * ( x -endt ) + bS;
pR = PeakBars( s11, per, 1 ) == 0;
endt1= LastValue(ValueWhen( pR, x, 1 ));
startt1=LastValue(ValueWhen( pR, x, 2 ));
dtR =endt1-startt1;
endR = LastValue(ValueWhen( pR, s11, 1 ) );
startR = LastValue( ValueWhen( pR, s11, 2 ));
aR = (endR-startR)/dtR;
bR = endR;
trendlineR = aR * ( x -endt1 ) + bR;
//Plot(trendlineR , "trendlineR" ,colorRed , styleLine);
//Plot(ValueWhen( (S1==trendlineS ), L),"", colorGreen, styleDashed|styleNoRescale|styleThick);
//Plot(ValueWhen((S11==trendlineR ), H),"", colorRed, styleDashed|styleNoRescale|styleThick);
Buy = Ref(Ref(Ref(Ref(Ref(Ref(Ref(Ref(Ref(Ref(Ref(S1==trendlineS,-1),-1),-1),-1),-1),-1),-1),-1),-1),-1),-1);
Sell = Ref(Ref(Ref(Ref(Ref(Ref(Ref(Ref(Ref(Ref(Ref(Ref(Ref(Ref(Ref(Ref(Ref(S11==trendlineR,-1 ),-1),-1),-1),-1),-1),-1),-1),-1),-1),-1),-1),-1 ),-1 ),-1 ),-1 ),-1 );
Buy = ExRem( Buy, Sell );
Sell = ExRem( Sell, Buy );
// Plot the ribbon
ribboncol= IIf( BarsSince(Buy)<BarsSince(Sell), colorGreen, colorRed );
Plot( 3, "", ribboncol, styleArea | styleOwnScale | styleNoLabel, 0, 100 );
PlotShapes(IIf(Buy, shapeSquare,shapeNone) ,colorBlue,0, Close, Offset=-10) ;
PlotShapes(IIf(Buy, shapeSmallUpTriangle,shapeNone) ,colorLime,0, Close, Offset=-10) ;
PlotShapes(IIf(Sell, shapeSquare,shapeNone),colorRed,0, Close, Offset=-1) ;
PlotShapes(IIf(Sell, shapeSmallDownTriangle,shapeNone),colorLime,0, Close, Offset=-1) ;
PlotShapes( Buy * shapeNone + Sell * shapeNone, IIf( Buy, colorBlue, colorPink) );
dist = 0.8*ATR(10);
dist1 = 2*ATR(10);
for( i = 0; i < BarCount; i++ )
{
 if( Buy[i] )
 {
  PlotText( "\nHNI Buy 10 Lots @" + C[ i ] + "\nTGT= " + (C[i]*1.0045) + "\nSL= " + (C[i]*0.9970), i, L[ i ]-dist[i], colorGreen, colorBlack );
 }
 if( Sell[i] )
 {
  PlotText( "HNI Sell 10 Lots @" + C[ i ] + "\nT= " + (C[i]*0.995) + "\nSL= " + (C[i]*1.0025), i, H[ i ]+dist1[i], colorRed, colorBlack );
 }
}


_SECTION_END();


Uphigh =  HHV(C,90);
downhigh = LLV (C, 40);
//Buy = C>= Uphigh;
//Sell = C<= downhigh;
Buy  = ExRem (Buy,Sell);
Sell = ExRem (Sell,Buy);


_SECTION_BEGIN("BACK COLOR");
SetChartBkGradientFill( ParamColor("BgTop", colorPlum),

ParamColor("BgBottom", colorBlack),ParamColor("titleblock",colorPlum));

Title = (EncodeColor(colorGold)+Day() + EncodeColor(colorWhite) + Name()+"  " + Date() +"  "+Interval(2) +"  "+ EncodeColor(colorWhite)+",Open "+Open +" , High "+H+" , Low "+L+" , Close "+C+" "+"{{VALUES}}");

BuyPrice = Open;
SellPrice = Open;

Derived=WMA(WMA(WMA(((H+L)/2)+(O-C),92),1),1);
i=WMA(Derived,3);
Upper=(Derived+StDev(Derived,7))+ATR(2)/1.5;
Lower=(Derived-StDev(Derived,7))-ATR(2)/1;

color=IIf(BarsSince(Cross(Lower,Low))>
BarsSince(Cross(C,Upper)), colorBrightGreen,colorRed);
Plot(C,"",color,64);


//WriteIf(s,"EXIT all Short positions\nif trading long positions, enter long Now-\nOR at the market price on tomorrow's Open with stop="+EncodeColor(4)+WriteVal(L+.75*ATR(5),1.4)+" ,","");
//WriteIf(ss,"exit all long positions today with a Market On Close (MOC) order\nOR at the market price on tomorrow's Open with stop="+EncodeColor(4)+WriteVal(Ref(H+.75*ATR(5), -1),1.4)+",","");
//WriteIf( sss ,"No trading signals today.","") ;


SetBarsRequired( 600, 0 );

GraphXSpace = 8;
SetChartOptions( 0, chartShowArrows | chartShowDates );


//============== TITLE ==============

_SECTION_BEGIN("Magnified Market Price");
FS=Param("Font Size",30,11,100,1);
GfxSelectFont("Times New Roman", FS, 700, True );
GfxSetBkMode( colorWhite );
GfxSetTextColor( ParamColor("Color",colorGold) );
Hor=Param("Horizontal Position",970,1,1200,1);
Ver=Param("Vertical Position",50,1,830,1);
GfxTextOut(""+C, Hor , Ver );
YC=TimeFrameGetPrice("C",inDaily,-1);
DD=Prec(C-YC,2);
xx=Prec((DD/YC)*100,2);
GfxSelectFont("Times New Roman", 11, 700, True );
GfxSetBkMode( colorWhite );
GfxSetTextColor(ParamColor("Color",colorBlack) );
GfxTextOut(""+DD+"  ("+xx+"%)", Hor , Ver+45 );

_SECTION_END();


_SECTION_BEGIN("Price Line");
dp= Param("dps",3,0,1000,1);
PriceLineColor=ParamColor("PriceLineColor",colorOrange);
PriceLevel = ParamField("PriceField", field = 3 );
PriceLeve2 = ParamField("PriceField", field = dp );
Daysback    = Param("Bars Back",1,10,500,1);
FirstBar    = BarCount - DaysBack;
 YY        = IIf(BarIndex() >= Firstbar,EndValue(PriceLevel),Null);

Plot(YY,"Current Price",PriceLineColor,ParamStyle("LineStyle",styleLine|styleDashed|styleNoTitle|styleNoLabel|styleThick,maskAll));

side = Param("side",1,0,1000,1);

dist = 0;

for( i = 0; i < BarCount; i++ )
{
 if(i+side== BarCount) PlotText( "\n    " + PriceLevel[ i ], i, YY[ i ]-dist[i], colorGold );

}

_SECTION_END();


       /****************/
		/*              */
		/* ALERT OUTPUT */
		/*              */
		/****************/

		TxtX = Param("Text Left", 600, 0, 1000, 10);
		TxtY = Param("Text Top", 60, 1, 650, 10);

		GfxSelectFont("Tahoma", 14, 700 );
		GfxSetBkMode(1);

		if(LastValue(Buy) OR SelectedValue(Buy))
			{
				GfxSetTextColor(colorGold);
				GfxTextOut("Waiting For Next Signal", TxtX, TxtY);
				Say("");
			}

		else if(LastValue(Sell) OR SelectedValue(Sell))
			{
				GfxSetTextColor(colorGold);
				GfxTextOut("Waiting For Next Signal", TxtX, TxtY);
				Say("");
			}

		else
			{
				GfxSetTextColor(colorGold);
              GfxTextOut("Waiting For Next Signal ", TxtX, TxtY);
				GfxTextOut("", TxtX, TxtY);
			}
_SECTION_BEGIN("sys");

x=Param("xposn",315,0,1000,1);
y=Param("yposn",576,0,1000,1);


_SECTION_END();


_SECTION_BEGIN("Background text");
C11=ParamColor("up panel",colorBlack );
C12=ParamColor("dn panel",colorBlack );
C13=Param("fonts",20,10,30,1 );
C14=Param("left-right",2.1,1.0,5.0,0.1 );
C15=Param("up-down",8,1,30,1 );
Miny = Status("axisminy");
Maxy = Status("axismaxy");
lvb = Status("lastvisiblebar");
fvb = Status("firstvisiblebar");
pxwidth = Status("pxwidth");
pxheight = Status("pxheight");
GfxSetBkMode( 0 );
GfxSelectFont("Tahoma", 12, 500, False, False, 0);
GfxSetTextColor(colorCustom12);
GfxSetTextAlign( 6 );
GfxSelectFont("Tahoma", 15, 600, False, False, 0);
GfxSetTextColor(colorWhite);
GfxSetTextAlign( 6 );

GfxSelectFont("Tahoma", 12, 400, False, False, 0);
GfxSetTextColor(colorBrightGreen);

GfxSelectFont("Tahoma", 12, 400, False, False, 0);
GfxSetTextColor(colorRed);


pricechange=(C-Ref(C,-1))*100/Ref(C,-1);
changeponit=C-Ref(C,-1);
Vlp=Param("Volume lookback period",15,10,300,10);
Vrg=MA(V,Vlp);
St = StDev(Vrg,Vlp);
Vp3 = Vrg + 3*st;
Vp2 = Vrg + 2*st;;
Vp1 = Vrg + 1*st;;
Vn1 = Vrg -1*st;
Vn2 = Vrg -2*st;

x=Param("xposn",1,0,1000,1);
y=Param("yposn",1,0,1000,1);

GfxGradientRect( 1, 1, 1400, 40, colorViolet, colorBlack);
GfxSetBkMode(0);
GfxSelectFont( "Georgia", 18, 800, False );
GfxSetTextColor( colorGold );
GfxTextOut( "General ", x+600, y+10 );
GfxSelectFont( "Tahoma", 16, 800, False );
GfxSetTextColor( colorGold );
GfxTextOut( Name(), x+100, y+10 );
GfxSelectFont( "Century Gothic", 15, 100, False );
GfxSetTextColor( colorGold );
GfxTextOut( Date(), x+1000, y+10 );
GfxSelectFont( "Comic Sans MS", 15, 500, False );
GfxSetTextColor( colorYellow );
GfxTextOut( Interval(2), x+275, y+10 );
//------------------------------------------------------------ H, L, O, C----------------------
GfxGradientRect( 1, 40, 1400, 55, colorViolet, colorBlack );
GfxSetBkMode(0);
GfxSelectFont( "Areal", 9, 200, False );
GfxSetTextColor( colorWhite );
GfxTextOut( "High:"+WriteVal(H,1.2), x+100, y+40 );
GfxSelectFont( "Areal", 9, 200, False );
GfxSetTextColor( colorWhite );
GfxTextOut( "Low:"+WriteVal(L,1.2), x+200, y+40 );
GfxSelectFont( "Areal", 9, 200, False );
GfxSetTextColor( colorWhite );
GfxTextOut( "Open:"+WriteVal(O,1.2), x+300, y+40 );
GfxSelectFont( "Areal", 9, 200, False );
GfxSetTextColor( colorWhite );
GfxTextOut( "Close:"+WriteVal(C,1.2), x+400, y+40 );
GfxSelectFont( "comic sans ms", 12, 100, False );
//-----------------------------------------------------------Valume-------------------------------


// set criteria to scan for big stock only;
BigStock = MA( V, 10 ) * MA( C, 10 ) > 100;

//---------------Color------------------------
per1 = 6;
per2 = 2;
Om = MA( O, per1 );
hm = MA( H, per1 );
lm = MA( L, per1 );
Cm = MA( C, per1 );

// 1. Heiken Ashi
HACLOSE = ( Om + Hm + Lm + Cm ) / 4;
HaOpen = AMA( Ref( HaClose,  -1 ),  0.5 );
HaHigh = Max( Hm,  Max( HaClose,  HaOpen ) );
HaLow = Min( Lm,  Min( HaClose,  HaOpen ) );


Of = MA( Haopen, per2 );
Cf = MA( Haclose, per2 );
Lf = IIf( haOpen < haClose, MA( Halow, per2 ), MA( Hahigh, per2 ) );
Hf = IIf( haOpen < haClose, MA( Hahigh, per2 ), MA( Halow, per2 ) );
//Color = IIf( Cf > Of, colorGreen, colorRed );


//----------------------------------------------------

TrailStop = HHV( C - 2 * ATR( 10 ), 15 );
ProfitTaker = EMA( H, 13 ) + 2 * ATR( 10 );

/* **********************************
Code to automatically identify pivots
********************************** */

// -- what will be our lookback range for the hh and ll?
farback = 140; //How Far back to go
nBars = 12; //Number of bars

// -- Create 0-initialized arrays the size of barcount
aHPivs = H - H;
aLPivs = L - L;

// -- More for future use, not necessary for basic plotting
aHPivHighs = H - H;
aLPivLows = L - L;
aHPivIdxs = H - H;
aLPivIdxs = L - L;
nHPivs = 0;
nLPivs = 0;
lastHPIdx = 0;
lastLPIdx = 0;
lastHPH = 0;
lastLPL = 0;
curPivBarIdx = 0;

// -- looking back from the current bar, how many bars
// back were the hhv and llv values of the previous
// n bars, etc.?
aHHVBars = HHVBars( O, nBars );
aLLVBars = LLVBars( O, nBars );
aHHV = HHV( O, nBars );
aLLV = LLV( O, nBars );

// -- Would like to set this up so pivots are calculated back from
// last visible bar to make it easy to "go back" and see the pivots
// this code would find. However, the first instance of
// _Trace output will show a value of 0
aVisBars = Status( "barvisible" );
nLastVisBar = LastValue( Highest( IIf( aVisBars, BarIndex(), 0 ) ) );
_TRACE( "Last visible bar: " + nLastVisBar );

// -- Initialize value of curTrend
curBar = ( BarCount - 1 );
curTrend = "";

if ( aLLVBars[curBar] < aHHVBars[curBar] )
{
    curTrend = "D";
}
else
{
    curTrend = "U";
}

// -- Loop through bars. Search for
// entirely array-based approach
// in future version
for ( i = 0; i < BarCount; i++ )
{
    curBar = ( BarCount - 1 ) - i;
// -- Have we identified a pivot? If trend is down...

    if ( aLLVBars[curBar] < aHHVBars[curBar] )
    {
// ... and had been up, this is a trend change
        if ( curTrend == "U" )
        {
            curTrend = "D";
// -- Capture pivot information
            curPivBarIdx = curBar - aLLVBars[curBar];
            aLPivs[curPivBarIdx] = 1;
            aLPivLows[nLPivs] = L[curPivBarIdx];
            aLPivIdxs[nLPivs] = curPivBarIdx;
            nLPivs++;
        }

// -- or current trend is up
    }
    else
    {
        if ( curTrend == "D" )
        {
            curTrend = "U";
            curPivBarIdx = curBar - aHHVBars[curBar];
            aHPivs[curPivBarIdx] = 1;
            aHPivHighs[nHPivs] = H[curPivBarIdx];
            aHPivIdxs[nHPivs] = curPivBarIdx;
            nHPivs++;
        }

// -- If curTrend is up...else...
    }

// -- loop through bars
}

// -- Basic attempt to add a pivot this logic may have missed
// -- OK, now I want to look at last two pivots. If the most
// recent low pivot is after the last high, I could
// still have a high pivot that I didn't catch
// -- Start at last bar
curBar = ( BarCount - 1 );

candIdx = 0;

candPrc = 0;

lastLPIdx = aLPivIdxs[0];

lastLPL = aLPivLows[0];

lastHPIdx = aHPivIdxs[0];

lastHPH = aHPivHighs[0];

if ( lastLPIdx > lastHPIdx )
{
// -- Bar and price info for candidate pivot
    candIdx = curBar - aHHVBars[curBar];
    candPrc = aHHV[curBar];

    if (
        lastHPH < candPrc AND
        candIdx > lastLPIdx AND
        candIdx < curBar )
    {
// -- OK, we'll add this as a pivot...
        aHPivs[candIdx] = 1;
// ...and then rearrange elements in the
// pivot information arrays

        for ( j = 0; j < nHPivs; j++ )
        {
            aHPivHighs[nHPivs-j] = aHPivHighs[nHPivs- ( j+1 )];
            aHPivIdxs[nHPivs-j] = aHPivIdxs[nHPivs-( j+1 )];
        }

        aHPivHighs[0] = candPrc ;

        aHPivIdxs[0] = candIdx;
        nHPivs++;
    }
}
else
{
// -- Bar and price info for candidate pivot
    candIdx = curBar - aLLVBars[curBar];
    candPrc = aLLV[curBar];

    if (
        lastLPL > candPrc AND
        candIdx > lastHPIdx AND
        candIdx < curBar )
    {
// -- OK, we'll add this as a pivot...
        aLPivs[candIdx] = 1;
// ...and then rearrange elements in the
// pivot information arrays

        for ( j = 0; j < nLPivs; j++ )
        {
            aLPivLows[nLPivs-j] = aLPivLows[nLPivs-( j+1 )];
            aLPivIdxs[nLPivs-j] = aLPivIdxs[nLPivs-( j+1 )];
        }

        aLPivLows[0] = candPrc;

        aLPivIdxs[0] = candIdx;
        nLPivs++;
    }
}

//============== EXPLORATION ==============
Buy = Cover = BigStock AND aLPivs == 1;

Sell = Short = BigStock AND aHPivs == 1;

SellPrice = ValueWhen( Sell, C, 1 );

BuyPrice = ValueWhen( Buy, C, 1 );

Long = Flip( Buy, Sell );

Shrt = Flip( Sell, Buy );

//============== Plot price ==============
n = 15;

a =  C > ( MA( H, n ) + MA( L, n ) ) / 2;// then Buy next bar at market;

b = C < ( MA( H, n ) + MA( L, n ) ) / 2;// then Sell Short next bar at market;

state = IIf( BarsSince( a ) < BarsSince( b ), 1, 0 );

Longs = state == 1;

shorts = state == 0;
5 comments
Leave Comment
Please login here to leave a comment.
Hi
so many syntax erriors,
most of are " Error 10"
pls help
thx
paresh
Hi
its my mistake… its working FINE.
thx
paresh
Hi Mr.Santosh,
Profitable AFL.
Can you also include audible sound when “SELL” and “BUY” signals are generated.
thanks
Signals are appearing too late
please correct it
can you anyone pls share the updated version? As said by Venkat, signals are appearing too late.. Please share it to my mail ID deepak.jdk@gmail.com. thanks a lot