Stock Portfolio Organizer
The ultimate porfolio management solution.
WiseTrader Toolbox
#1 Selling Amibroker Plugin featuring:
Ultimate Divergence Detector for Amibroker (AFL)
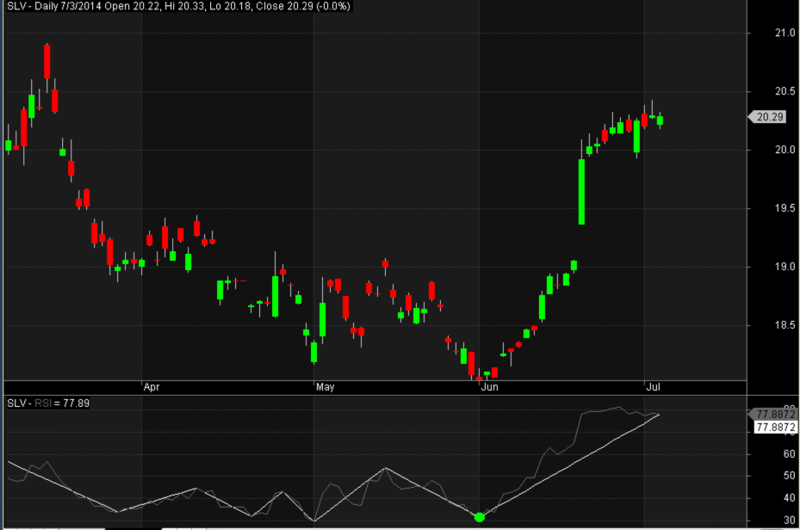
Divergence is one of the most reliable trading signals, but it’s tricky to identify divergences in real time and if you’re not paying attention, it’s easy to miss a divergence. There are a bunch of divergence detectors posted here, so why another one? Well, I tried all the ones I found and none of them really met my needs, so I decided to create my own. Here’s what makes mine different:
1. Most divergence detectors look for peaks and troughs in price and then try to find a nearby peak or trough in RSI. I took the opposite approach. UDD looks for higher RSI lows and lower RSI peaks. It then looks for divergences between price and RSI at the current RSI peak/trough, compared with the previous one. I feel this is a more reliable method of identifying divergences, because RSI is less noisy than price. If you want to use a different indicator from RSI, it just involves changing one line of code.
2. UDD plots the RSI and overlays the Zig-Zag indicator on top of it. It then plots a green dot identifying each bullish divergence and a red dot identifying each bearish divergence. This makes it easy for the user to see the divergence. Just follow the Zig-Zag line back to the prior zig/zag point on the graph. The prior point is where the divergence began and the red or green dot is the trade entry point.
3. UDD allows the user to specify the RSI length and the percentage change threshold. As you adjust these values, the graph dynamically updates, so you can see the effect of the change in real time. The default RSI length of 14 and percentage threshold of 10% may be too noisy for many markets. If you see too many false signals on the graph, just increase these values until you’re comfortable with how the graph looks.
4. UDD uses pure array processing, no loops, so it’s extremely fast and the code is compact and easy to understand.
5. UDD includes a simple trading system with backtesting. The system buys on each bullish divergence and goes short on each bearish divergence. It exits the trade at the next point on the zig-zag line. For instance, if it goes short on a bearish divergence, it will exit the trade at the next trough. If you backtest this against a variety of markets, you may be surprised at how profitable it is.
Screenshots
4 comments
Leave Comment
Please login here to leave a comment.
Back
looks like good indicator
Does using ZigZag makes it future looking? Please help clarify..
Good one…it’s not looking into future.
This is indicator is looking good!!