Long Term Trend for Amibroker (AFL)
haywood almost 12 years ago Amibroker (AFL)
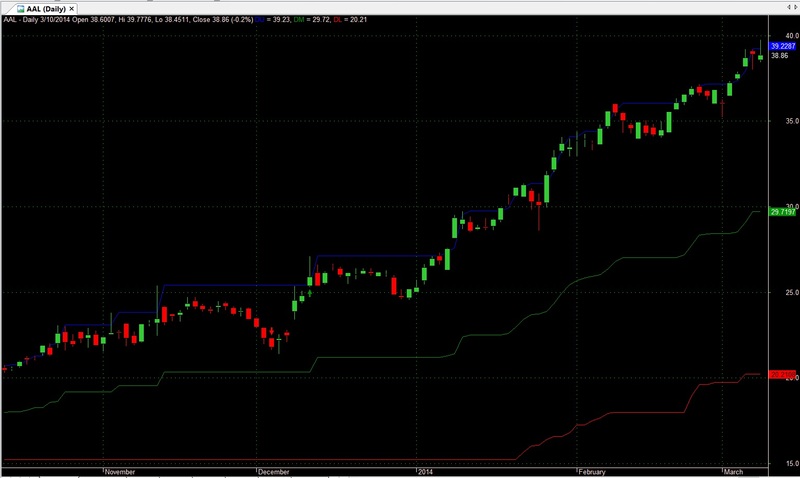
Basic breakout trend following system.
Screenshots
Indicator / Formula
Copy & Paste Friendly
_SECTION_BEGIN("Long Term Trend");
SetChartOptions(0,chartShowArrows|chartShowDates);
_N(Title = StrFormat("{{NAME}} - {{INTERVAL}} {{DATE}} Open %g, Hi %g, Lo %g, Close %g (%.1f%%) {{VALUES}}", O, H, L, C, SelectedValue( ROC( C, 1 ) ) ));
Plot( C, "Close", ParamColor("Color", colorBlack ), styleNoTitle | ParamStyle("Style") | GetPriceStyle() );
Filter = C > 5 AND V>10;
///////////////////////////////////////
DonchianUpper =HHV(Ref(H,-1),100);
DonchianLower = LLV(Ref(L,-1),100);
DonchianMiddle = (DonchianUpper+DonchianLower)/2;
Plot(DonchianUpper,"DU",colorBlue,styleLine);
Plot(DonchianMiddle,"DM",colorGreen,styleLine);
Plot(DonchianLower,"DL",colorRed,styleLine);

////////////////////////////////////////////////
Buy= C > DonchianUpper ;
Sell= C < MA(C,50) OR C <DonchianLower ;
Buy = ExRem(Buy,Sell);
Sell = ExRem(Sell,Buy);
shape = Buy * shapeUpArrow + Sell * shapeDownArrow;
PlotShapes( shape, IIf( Buy, colorGreen, colorRed ),0, IIf( Buy, Low, High ) );
3 comments
Leave Comment
Please login here to leave a comment.
nice afl
nice afl…thanks
Hi every body,
Now i want analysis in amibroker weekly chart but amibroker show daily chart. Please help me. Thsnks you.
My email nguyentranhung6688@gmail.com.