Days-Bars-Gain Counter for Amibroker (AFL)
trader.bol.linger@gmail.com over 11 years ago Amibroker (AFL)
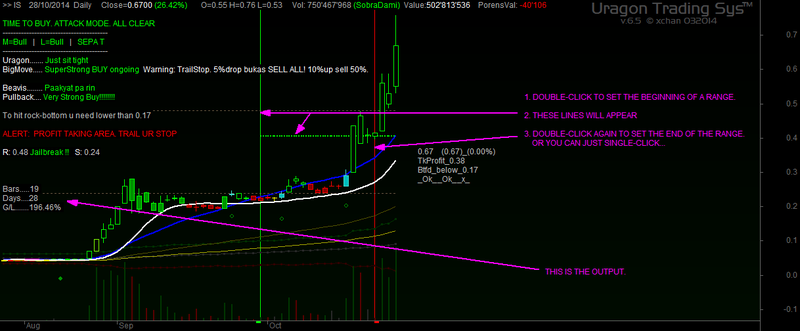
This will show you the “Days”, “Bar count”, and “Gain/Loss%” within your
selected range.
Append this code at the end of your afl.
Append this code at the end of your afl.
How to use/activate. Example:
1.Double-click any bar from last month (this will set the beginning of a range)
*Vertical line and horizontal line will appear.
*New info will appear on your chart, left-side.
2.Single-click OR Double-click any bar from this month (this will set the
end of the range).
How to deactivate:
1.Double-click anywhere on your chart (the lines will disappear).
*if your double-click created another line then double-click again.
Regards,
Bol Linger
FB: Stock Exploit Pilipinas
Screenshots
Indicator / Formula
/*
This will show you the "Days", "Bar count", and "Gain/Loss%" within your selected range.
Append this code at the end Of your afl.

How to use/activate. Example:
1.Double-click any bar from last Month (this will set the begining of a range)
   *Vertical line and horizontal line will appear.
   *New info will appear on your chart, left-side.
2.Single-click OR Double-click any bar from this Month (this will set the end of a range).

How to deactivate:
1.Double-click anywhere on your chart (the vertical line will disappear).
   *if your double-click created another line then double-click again.

Regards,
Bol Linger
FB: Stock Exploit Pilipinas
*/

_SECTION_BEGIN("DayBarCounter");
if (BeginValue(BarIndex()) != 0 )
{
Lvl = ParamField("PriceField", field = 3 );
FirstBar = BeginValue(BarIndex());
Linya  = IIf(BarIndex() >= FIRstbar, EndValue(Lvl),Null);
Range = BarIndex()-BeginValue(BarIndex());
Title += EncodeColor(colorLightGrey)+StrFormat("\n\nBars.....%g ", range)
+"\nDays...."+ WriteVal( DaysSince1900() - BeginValue( DaysSince1900()),1)
+ WriteIf(DaysSince1900() - BeginValue( DaysSince1900())>30,
     "  (" + WriteVal( (DaysSince1900() - BeginValue( DaysSince1900()))/30,1.2)
+ WriteIf(  ((DaysSince1900() - BeginValue(DaysSince1900()))/30)>=2,"months)","month)"),"")
+"\nG/L......." +WriteVal((C - BeginValue(C))/BeginValue(C)*100,1.2 ) + "% ";
Plot(Linya,"",colorBrightGreen,ParamStyle("LineStyle",styleLine|styleDashed|styleNoTitle|styleNoLabel|styleThick,maskAll));
}
_SECTION_END();
6 comments
Leave Comment
Please login here to leave a comment.
Great Work.
Thanks for sharing.
Sk.
Dear Bol Linger,
Its not working in my Amibroker 5.72 version. Would you please help me?
Regards
Nahid
Sir superb ,
it can be use to locate price n time square.
gift for your idea and afl.
Little help needed this side!
_SECTION_BEGIN("CustomCum");
SetChartOptions(0,chartShowArrows|chartShowDates);
vol = Volume/75;
coi = OpenInt - Ref(OpenInt, -1);
WriteVal( BeginValue( DateTime() ), formatDateTime );
WriteVal( EndValue( DateTime() ), formatDateTime );
Range = (BeginValue(DateTime()) + BarsSince( EndValue(DateTime())));
///Bar_today = 1 + BarsSince( Day() != Ref(Day(), -1));
Alltotal = Sum(coi,Range);
diff = Alltotal ;
diffcolor = colorBrightGreen;
SetBarFillColor( diffcolor );
PlotOHLC(0,diff,0,diff, "CustomCum", colorWhite, style=styleCandle|styleOwnScale);
_SECTION_END();
I want to mark bars of a custom range of an indicator plotted and want to sum total values of each bars within the range. And I want to plot that value in OHLC format either in new pane or in the same pane.

GREAT WORK
THANKS