Elder Impulse for Amibroker (AFL)
jayasheelk over 16 years ago Amibroker (AFL)
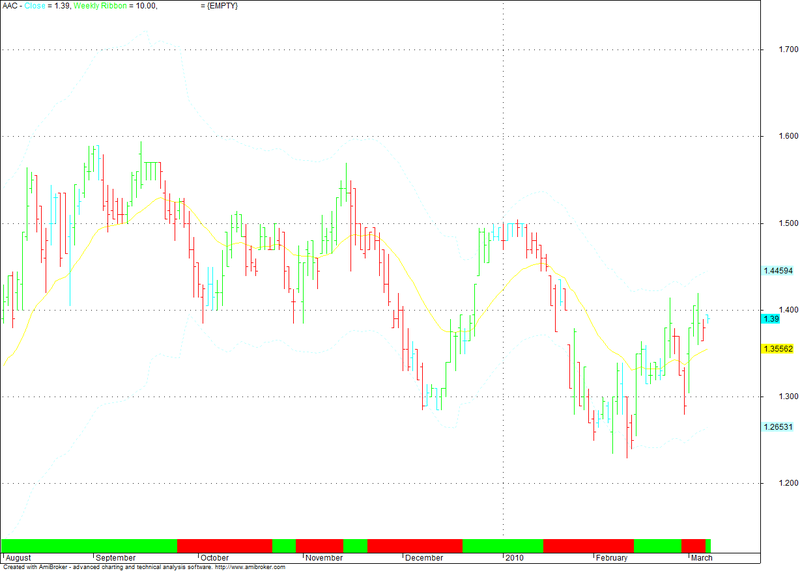
A normal chart pattern using elder impulse
Screenshots
Indicator / Formula
Copy & Paste Friendly
_SECTION_BEGIN("Elder Impulse");

SetChartOptions(0,chartShowArrows|chartShowDates);
EnableTextOutput(False);

// User-defined parameter for EMA periods

EMA_Type	 = Param("EMA-1, TEMA-2, JMA-3", 2, 1, 3, 1);
EMA_prds = Param("EMA_periods", 7, 1, 30, 1);
Std_MACD	 = Param("Standard MACD? No-0, Yes-1", 1, 0, 1, 1);
Plot_fashion	= Param("Bar+Arrows-1, Impulse Bars-2", 2, 1, 2, 1);


// Allow user to define Weekly and Monthly Ribbon Location and Height
WR_P1 = Param("Weekly Ribbon Location", 5.2, -1000, 1000, 0.1);
WR_P2 = Param("Weekly Ribbon Height", 199, -0.001, 500, 0.1);

//MR_P1 = Param("Monthly Ribbon Location", 5.2, -1000, 1000, 0.1);
//MR_P2 = Param("Monthly Ribbon Height", 199, -0.001, 500, 0.1);


// Compute EMA and MACD Histogram
if(EMA_Type == 1)
{
DayEMA	= EMA(Close, EMA_prds);
}
if (EMA_Type == 2)
{
DayEMA	= TEMA(Close, EMA_prds);
}

if(EMA_Type == 3)
{
// Line below to be used with Jurik JMA
// DayEMA = JurikJMA(C, EMA_Prds);
}

Histogram	= MACD() - Signal();

// Determine if we have an Impulse UP, DOWN or None
Impulse_Up	 =	DayEMA > Ref(DayEMA, -1) AND Histogram > Ref(Histogram, -1);
Impulse_Down	=	DayEMA < Ref(DayEMA, -1) AND Histogram < Ref(Histogram, -1);
Impulse_None	 =	(NOT Impulse_UP) AND (NOT Impulse_Down);

// Compute Weekly MACD and determine whether rising or falling
// Note: uses "non-standard" parameters!
TimeFrameSet(inWeekly);

if (Std_MACD == 0)
{
MACD_val	 =	MACD(5, 8);
Signal_val	 =	Signal(5, 8, 5);
}
else
{
MACD_val	 =	MACD(12, 26);
Signal_val	 =	Signal(12, 26, 9);
}

Hist_in_w	 =	MACD_val - Signal_val;

wh_rising = Hist_in_w > Ref(Hist_in_w, -1);
wh_falling = Hist_in_w < Ref(Hist_in_w, -1);
wh_none = (NOT wh_rising) AND (NOT wh_falling);

TimeFrameRestore();

// Now get Monthly MACD Histogram....
TimeFrameSet(inMonthly);
MACD_val	 =	MACD(5, 8);
Signal_val	 =	Signal(5, 8, 5);
Hist_in_m	 =	MACD_val - Signal_val;

mh_rising = Hist_in_m > Ref(Hist_in_m, -1);
mh_falling = Hist_in_m < Ref(Hist_in_m, -1);

TimeFrameRestore();

wh_rising = TimeFrameExpand( wh_rising, inWeekly, expandLast );
wh_falling = TimeFrameExpand( wh_falling, inWeekly, expandLast);
wh_none = TimeFrameExpand( wh_none, inWeekly, expandLast);
mh_rising = TimeFrameExpand(mh_rising, inMonthly, expandLast);
mh_falling = TimeFrameExpand(mh_falling, inMonthly, expandLast);

kol = IIf( wh_rising, colorBrightGreen, IIf(wh_falling, colorRed, IIf(wh_none, colorCustom11, colorLightGrey)));
mkol = IIf( mh_rising, colorBlue, IIf(mh_falling, colorYellow, colorLightGrey));

// Plot them all!
if (Plot_fashion == 1)
{
Plot(Close, "Close", colorTeal, styleBar);
PlotShapes(shapeUpArrow * Impulse_Up, colorBrightGreen, 0, Low, -12);
PlotShapes(shapeDownArrow * Impulse_Down, colorRed, 0, High, -12);
PlotShapes(shapeSmallCircle * Impulse_None, colorWhite, 0, High, 5);
}
else
{
bar_kol	=	IIf(impulse_UP, colorBrightGreen, IIf(impulse_Down, colorRed, colorCustom11));
Plot(C, "Close", bar_kol, styleBar);
}

Plot(10, "Weekly Ribbon", kol, styleOwnScale|styleArea|styleNoLabel, WR_P1, WR_P2);	// Weekly trend GREEN = RISING, RED = FALLING, WHITE = NEUTRAL
//Plot(10, "Monthly Ribbon", mkol, styleOwnScale|styleArea|styleNoLabel, MR_P1, MR_P2);	// Monthly Trend BLUE = RISING, YELLOW = FALLING, WHITE = NEUTRAL

// Auto Envelope
PlotForeign(GetBaseIndex(),IndustryID(1),colorWhite,styleLine|styleLeftAxisScale);

LookBkPd = 100 ;
AvgPd = 22 ;
ExternalBarPct = 15 ;
ConvergePct = 2 ;
Middle = EMA( C,AvgPd ) ;
Rng = HHV( H,LookBkPd ) - LLV( L,LookBkPd ) ;
X = Rng ;
deltaX = X/2 ;
do
{
Over = H > Middle + X ;
Under = L < Middle - X ;
OuterPct = 100*( Sum( Over, LookBkPd ) + Sum( Under, LookBkPd )
)/LookBkPd ;
OP = LastValue(OuterPct) ;
X=X+sign( OP - ExternalBarPct )*deltaX ;
deltaX = deltaX/2 ;
}while ( abs( OP - ExternalBarPct ) > ConvergePct ) ;
Plot( Middle, "MA", colorYellow, styleLine|styleNoTitle ) ;
Plot( Middle+X, "MA", colorSkyblue, styleDashed|styleNoTitle ) ;
Plot( Middle-X, "MA", colorSkyblue, styleDashed|styleNoTitle ) ;


// Explorer Section
// Determine if Impulse status is bullish, neutral or bearish. Display as Text Column.
Impulse_State	 =	WriteIf(Impulse_Up, "Bulllish", WriteIf(Impulse_Down, "Bearish", "Neutral"));

// Set the background color for Impulse Status Column
Impulse_Col	 =	IIf(Impulse_Up, colorGreen, IIf(Impulse_Down, colorRed, colorLightGrey));

// Determine Weekly Trend. Display as Text Column
Weekly_Trend	 =	WriteIf(wh_rising, "Rising", WriteIf(wh_falling, "Falling", "Flat!"));
Weekly_Col	 =	IIf(wh_rising, colorGreen, IIf(wh_falling, colorRed, colorLightGrey));

// Determine Monthly Trend. Display as Text Column
Monthly_Trend	=	WriteIf(mh_rising, "Rising", WriteIf(mh_falling, "Falling", "Flat!"));
Monthly_Col	 =	IIf(mh_rising, colorGreen, IIf(mh_falling, colorRed, colorLightGrey));

// Determine how many bars has the current state existed
bars_in_bull	=	Min(BarsSince(impulse_none), BarsSince(impulse_down));
bars_in_bear	=	Min(BarsSince(impulse_up), BarsSince(impulse_none));
bars_in_neut	=	Min(BarsSince(impulse_down), BarsSince(impulse_up));

// Set a single variable to show number of bars in current state depending upon
// actual Impulse Status - Bullish, Bearish or Neutral
bars_in_state	=	IIf(Impulse_Up, bars_in_bull, IIf(Impulse_down, bars_in_bear, bars_in_neut));

// Columns for display in Explorer
AddTextColumn(Impulse_State, "Impulse Status", 1, colorWhite, Impulse_Col);
AddColumn(bars_in_state, "Bars in this state", 1, colorWhite, Impulse_col);
AddTextColumn(Weekly_Trend, "Weekly Trend", 1, colorWhite, Weekly_Col);
AddTextColumn(Monthly_Trend, "Monthly Trend", 1, colorWhite, Monthly_Col);

Filter = 1;
2 comments
Leave Comment
Please login here to leave a comment.
Output does not match the screenshot given.
Finally, I got one that works perfect, Thank you.