MIRIP YG MAHAL (T3B) BY TIMUR LANGIT for Amibroker (AFL)
tale over 11 years ago Amibroker (AFL)
To predict the probability of ups and downs
Must fairest in the settings of the index, including suits
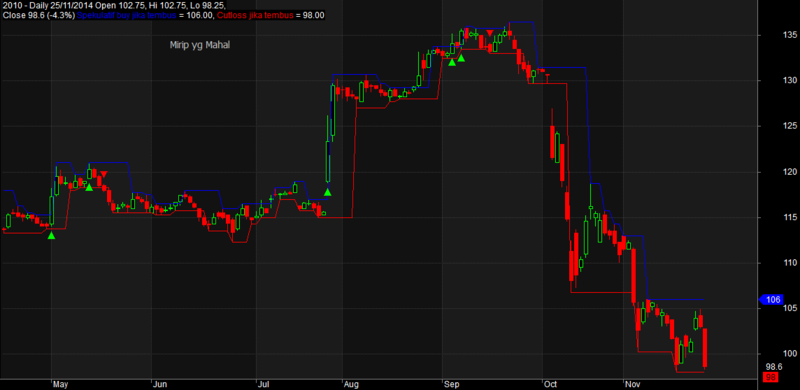
Screenshots
Indicator / Formula
Copy & Paste Friendly
// MIRIP YG MAHAL (T3B) BY TIMUR LANGIT

SetChartOptions( 0, chartShowArrows|chartShowDates );


_SECTION_BEGIN("Fractal");

UpFractal= ValueWhen(
(Ref(H,-2) >= Ref(H, -3)) AND
(Ref(H,-2) >= Ref(H, -1)) AND
(Ref(H,-2) >= H), Ref(H,-2));


DownFractal= ValueWhen(

(Ref(L,-3) <= Ref(L, -4)) AND
(Ref(L,-3) <= Ref(L, -2)) AND
(Ref(L,-3) <= Ref(L, -1)) AND
(Ref(L,-3) <= L), Ref(L,-3));
Buy = (Ref(C,-1)<=UpFractal) AND C>UpFractal AND V >= MA(V,20);
Sell = (Ref(C,-1)>=DownFractal) AND C<DownFractal;


//Buy=ExRem(Buy,Sell);

Sell=ExRem(Sell,Buy);
PlotShapes(IIf(Buy,shapeSmallUpTriangle,Null), colorBrightGreen, 0, L, -15);
PlotShapes(IIf(Sell,shapeSmallDownTriangle,Null), colorRed , 0, H, -15);
Plot(Ref(UpFractal,2), "Spekulatif buy jika tembus",
ParamColor("resistance",colorBlue), ParamStyle("Up Fractal Style", styleLine));
Plot(Ref(DownFractal,3), "Cutloss jika tembus",ParamColor("Support",colorRed),
ParamStyle("Down Fractal Style", styleLine));

_SECTION_END();


_SECTION_BEGIN("Exploration");
//Filter = (Buy OR Sell) AND V > 0; /*AND (C>=PriceFrom AND C<=PriceTo) AND V>0;
Filter = (Buy OR Sell) AND V > 5000;
AddTextColumn( WriteIf(Buy,"Buy", WriteIf(Sell, "Sell", "")), "Trade", 1.0);
AddColumn( UpFractal, "resistance");
AddColumn( DownFractal, "suport");
AddColumn( C, " Close");

_SECTION_END();


_SECTION_BEGIN("Price1");
SetChartOptions(0,chartShowArrows|chartShowDates);
_N(Title = StrFormat("{{NAME}} - {{INTERVAL}} {{DATE}} Open %g, Hi %g, Lo %g,
Close %g (%.1f%%) {{VALUES}}", O, H, L, C, SelectedValue( ROC( C, 1 ) ) ));
Plot( C, "close", ParamColor("Color", colorBlack ), styleNoTitle |
ParamStyle("Style") | GetPriceStyle() );

_SECTION_END();

_SECTION_BEGIN("");
GfxSetOverlayMode(1);
GfxSelectFont("Tahoma", Status("pxheight")/50 );
GfxSetTextAlign( 6 );// center alignment
GfxSetTextColor( ParamColor( "Warna", colorLightGrey ) );
GfxSetBkMode(0); // transparent
GfxTextOut( "Mirip yg Mahal", Status("pxwidth")/4,
Status("pxheight")/10 );

_SECTION_END();
4 comments
Leave Comment
Please login here to leave a comment.
Mantap bro, thanks a lot
It seems to be pretty good. Just a query….
Can anyone tell me if this formula looks into the future ?
Thanks
MIRIP DENGAN AFL YANG MANA BRO..? MOHON PENCERAHAN.