Volume Zone Ocillator - Moddified for Amibroker (AFL)
MA5YK over 11 years ago Amibroker (AFL)
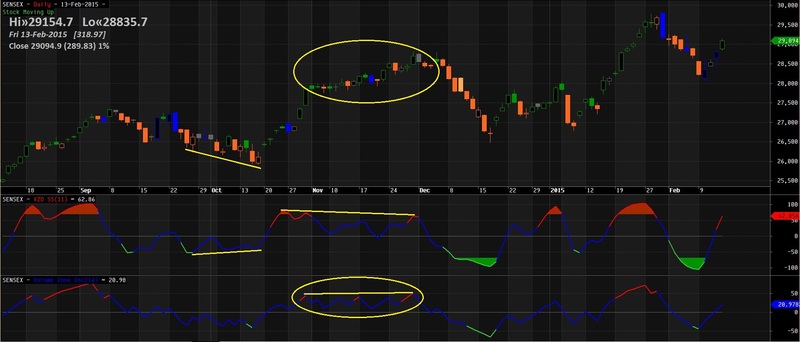
The VZO discerns bullish volume from bearish volume and is useful for
identifying at which zone (bullish or bearish) volume is positioned.
The oscillator is plotted on a vertical scale of -100 to +100. Movements above
+49 are considered overbought, while an oversold condition would be a move
under -49.
Movements above +69 mark extreme overbought levels, while an extreme oversold
condition is a move under -69.
The Zero line demonstrates equilibrium between Buyers and Sellers.
Components of VZO are…
- Your favorite Moving Average (try FRAMA)
- ADX
- Seven oscillator zones: +69, +49, +24, Zero, -14, -49 and -69.
I’ve tried to compensate the zones to adapt to the SuperSmoother.
Action is trending when ADX is >18 while <18 is sideways action.
Image compares the regular VZO with this one.
Screenshots
Indicator / Formula
_SECTION_BEGIN("VZO SS");
/*
// Tested on version 5.9 //
The VZO discerns bullish volume from bearish volume and is useful for
identifying at which zone (bullish or bearish) volume is positioned.

The oscillator is plotted on a vertical scale of -100 to +100. Movements above
+49 are considered overbought, while an oversold condition would be a move
under -49.

Movements above +69 mark extreme overbought levels, while an extreme oversold
condition is a move under -69.

The Zero line demonstrates equilibrium between Buyers and Sellers.

Components of VZO are...
-- Your favorite Moving Average (try FRAMA)
-- ADX
-- Seven oscillator zones: +69, +49, +24, Zero, -14, -49 and -69.

I've tried to compensate the zones to adapt to the SuperSmoother.

Action is trending when ADX is >18 while <18 is sideways action.
*/

GraphXSpace = 5;

PI = 3.1415926 ;
SQ2 = sqrt( 2 );

function SuperSmoother( array, period )
{
    a1 = exp( -SQ2 * PI / period );
    b1 = 2 * a1 * cos( SQ2 * PI / period );
    c2 = b1;
    c3 = -a1 * a1;
    c1 = 1 - c2 - c3;

    Filt = Nz( array );

    for ( i = 2; i < BarCount; i++ )
    {
         Filt[ i ] = c1 * ( array[ i ] + array[ i - 1 ] ) / 2 +
                     c2 * Filt[ i - 1 ] +
                     c3 * Filt[ i - 2];
    }

    return Filt;
}

function VZO( Period )
{
 R = sign( Close - Ref( Close, -1 ) ) * V;
 VP = SuperSmoother( R, Period );
 TV = SuperSmoother( V, Period );
 return Nz( 100 * VP / TV );
}

Period = Param("Period", 11, 1, 100 );
ADX_Level = Param("ADX Level", 18, 1, 100 );
VZO_Color = IIf( VZO( Period ) > 49, colorRed,
			IIf( VZO( Period ) < -49, colorLime,
			IIf(ADX(Period) > ADX_Level, colorBlue, colorDarkGrey  )));
Plot( VZO( Period ), "VZO-SS with ADX by MODDI" + _PARAM_VALUES(), VZO_Color, styleThick );
PlotOHLC( VZO( Period ),VZO( Period ),0,VZO( Period ), "", IIf( VZO( Period ) > 0, colorBrown /*Top*/, colorGreen /*Bottom*/ ), styleNoLabel | styleCloud | styleClipMinMax, -69, 69 );
Plot( 0, "", colorGrey40, styleNoLabel  );
Plot( -14, "", colorGrey40, styleDashed | styleNoLabel  );
Plot( 24, "", colorGrey40, styleDashed | styleNoLabel  );
/*Plot( 69, "", colorGrey40, styleNoLabel );
Plot( 49, "", colorGrey40, styleDashed | styleNoLabel  );
Plot( -49, "", colorGrey40, styleDashed | styleNoLabel  );
Plot( -69, "", colorGrey40, styleNoLabel  );
*/
_SECTION_END();
7 comments
Leave Comment
Please login here to leave a comment.
Nice work.
I tried posting a variation of your code here, but the website HTML interpreter
is messing and changing the code. Even when I enclose the code portion with the @ symbols provided in the editor. So sorry cant post here.
I note this is an on going issue with this website.
George
Post the code. I will fix the comment up. Normally it is "bc.. " at the beginning of the code for markitup.
Interesting formula. I would like to do and Exploration and to do so could you give me the BUYand Sell (Red or brown) on your chart formulas.Thanks so much
Dick
re#3: Dick, try using the lines below, based on an optimization I did on my TSE stocks. I found this trading system results to be very dependent on the levels chosen to Buy and Sell.
Thanks still-learning,
Your help is most appreciated and works. I was hoping the Buy/Sell signal would
approximate or be very similar to the ones on the chart (green bottom and Red Top.
My programing skill are minimal so your help will be extremely helpful.
Dick Hoierman
email: “areehoi@yahoo.com”
re#5: Dick, then what you are looking for is probably something like below? Just change the -70 and 70 values to see how much difference they make when you backtest. The values that worked best for me were 50 and -20, as per my previous post.
I thought I’d post the original settings. I’ve found them a bit lagging at times in my market but they might work better in other markets. Please add the following lines to your downloaded code for reference.
(Original levels: +60, +40, +15, Zero, -5, -40 and -60)
(Original period: 14)