Tillson's T3 Price, Chart and System for Amibroker (AFL)
kaiji over 16 years ago Amibroker (AFL)
This a price chart and system using Tillson’s T3 for Amibroker.
Screenshots
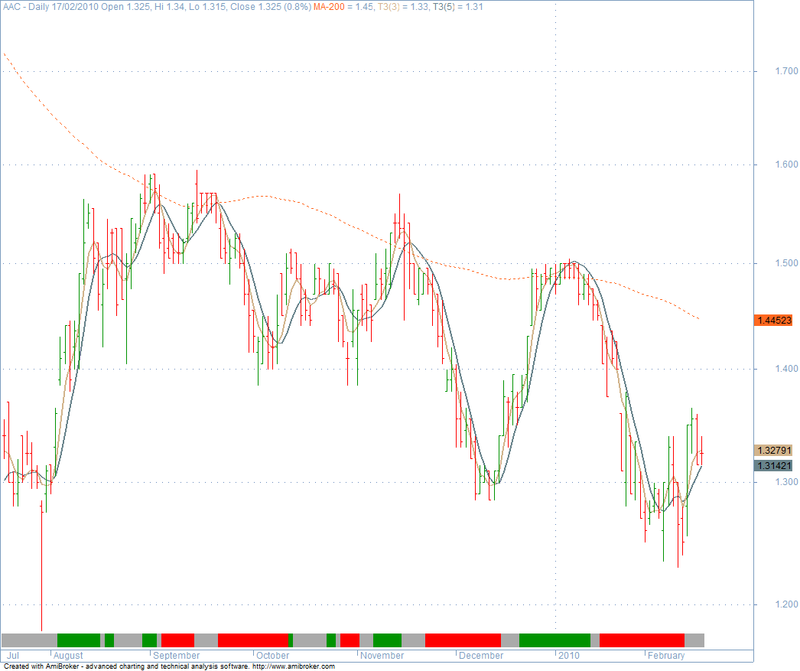
Indicator / Formula
Copy & Paste Friendly
_SECTION_BEGIN("Price");
SetChartOptions(0,chartShowDates|chartShowArrows|chartLogarithmic|chartWrapTitle);
_N(Title = StrFormat("{{NAME}} - {{INTERVAL}} {{DATE}} Open %g, Hi %g, Lo %g, Close %g (%.1f%%) {{VALUES}}", O, H, L, C, SelectedValue( ROC( C, 1 ) )));

Plot( C, "", IIf(Close > Open, colorGreen, colorRed), styleBar + styleNoLabel);
_SECTION_END();

_SECTION_BEGIN("trending ribbon");
uptrend=PDI()>MDI()AND Signal()<MACD();
downtrend=MDI()>PDI()AND Signal()>MACD();
Plot( 2, "",IIf( uptrend, colorGreen, IIf( downtrend, colorRed, 0 )), styleOwnScale|styleArea|styleNoLabel, -0.5, 100 );
_SECTION_END();

function T3(price,periods) //AMA-based
{
	s = 0.618;
	periods = 2/(periods+1);
	e1=AMA(price,periods);
	e2=AMA(e1,Periods);
	e3=AMA(e2,Periods);
	e4=AMA(e3,Periods);
	e5=AMA(e4,Periods);
	e6=AMA(e5,Periods);
	c1=-s*s*s;
	c2=3*s*s+3*s*s*s;
	c3=-6*s*s-3*s-3*s*s*s;
	c4=1+3*s+s*s*s+3*s*s;
	Ti3=c1*e6+c2*e5+c3*e4+c4*e3;
	return ti3;
}

Plot (MA (C,200), "MA-200", colorOrange, styledashed);
Plot(T3(C,3),"T3(3)",colorTan,styleThick);
Plot(T3(C,5),"T3(5)",colorPaleBlue,styleThick);

Buy = Cross (T3(C,3), T3(C,5))AND strlen(name())==3;
Sell =  Cross (T3(C,5), T3(C,3))AND strlen(name())==3;

Filter = Buy OR Sell;

AddColumn(Buy, "Buy", 1);
AddColumn(Sell, "Sell", 1);
AddColumn(V, "Volume", 1);
AddColumn(C, "Close", 1.2);
0 comments
Leave Comment
Please login here to leave a comment.