John F. Ehlers Autocorrelation Reversals for Amibroker (AFL)
Unlis about 11 years ago Amibroker (AFL)
Good Day!
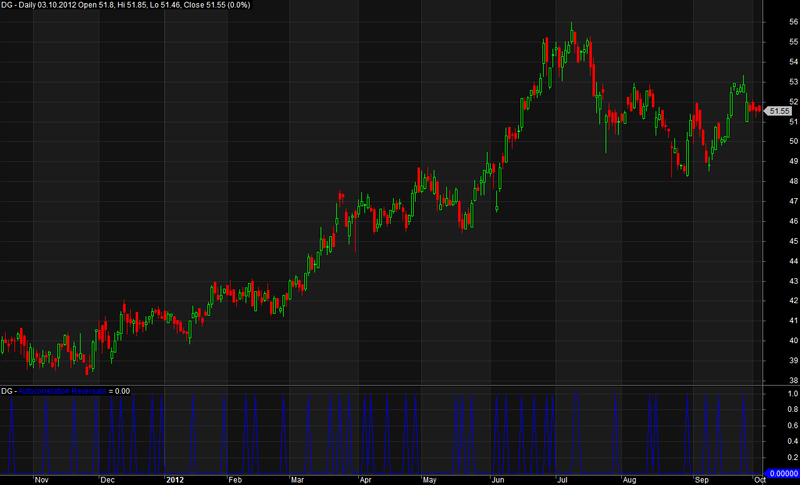
Let Me present to you another indicator “Correlation Reversals” from the book “Cycle Analytics for Traders”. As You can see from the screenshot, this indicator differ from the data in the book, perhaps it is related to the input data, or with the accuracy of calculation of AmiBroker. In any case, the criticism is appropriate.
Best Regards, Ilya.
E-mail: unlis@bk.ru,
Skype: unlis_root
Screenshots
Indicator / Formula
Copy & Paste Friendly
/*
	Autocorrelation Reversals
	2013 John F. Ehlers
*/

SetBarsRequired(sbrAll);

AvgL = Param("AvgLength", 3, 0, 10);
LPeriod = Param("Low-pass Period", 10, 3, 20);
HPeriod = Param("High-pass Period", 48, 22, 80);

pi=3.1415926;

function RoofingFilter(lpPeriod, hpPeriod)
{
	alpha1 = (cos(0.707*2*pi / hpPeriod) + sin(0.707*2*pi / hpPeriod) - 1) / cos(0.707*2*pi / hpPeriod);
	a1 = exp(-1.414*pi / lpPeriod);
	b1 = 2*a1*cos(1.414*pi / lpPeriod);
	c2 = b1;
	c3 = -a1*a1;
	c1 = 1 - c2 - c3;

	HP = Close;
	Filt = HP;

	for(i = 2; i < BarCount; i++)
	{
		HP[i] = ((1 - alpha1 / 2)^2)*(Close[i] - 2*Close[i-1] + Close[i-2]) + 2*(1 - alpha1)*HP[i-1] - ((1 - alpha1)^2)*HP[i-2];
		Filt[i] = c1*(HP[i] + HP[i-1]) / 2 + c2*Filt[i-1] + c3*Filt[i-2];
	}

	return Filt;
}

function AutocorrelationReversals(data, avgLength)
{
	//Pearson correlation for each value of lag
	for(lag = 3; lag <= 48; lag++)
	{
		//Set the average length as M
		M = avgLength;
		if(avgLength == 0)
			M = lag;
		//Initialize correlation sums
		Sx = 0;
		Sy = 0;
		Sxx = 0;
		Syy = 0;
		Sxy = 0;
		//Advance samples of both data streams and sum Pearson components
		for(count = 0; count <= M-1; count++)
		{
			X = Ref(data, -count);
			Y = Ref(data, -(lag + count));
			Sx += X;
			Sy += Y;
			Sxx += X^2;
			Syy += Y^2;
			Sxy += X*Y;
		}
		var1 = (M*Sxx - Sx^2)*(M*Syy - Sy^2);
		//Scale each correlation to range between 0 and 1
		VarSet("corr" + lag, IIf(var1 > 0, 0.5*((M*Sxy - Sx*Sy)/sqrt(var1) + 1), 0));
	}

	sumDeltas = 0;	//sum the bar-to-bar differences of the autocorrelation function across all values of lag

	for(lag = 3; lag <= 48; lag++)
	{
		corrShift0 = VarGet("corr" + lag);
		corrShift1 = Ref(corrShift0, -1);
		result = IIf((corrShift0 > 0.5 AND corrShift1 < 0.5) OR (corrShift0 < 0.5 AND corrShift1 > 0.5), 1, 0);
		sumDeltas += result;
	}

	reversal = IIf(sumDeltas > 24, 1, 0);

	Plot(reversal, "Autocorrelation Reversals", colorBlue);

	return reversal;
}

filtData = RoofingFilter(LPeriod, HPeriod);
AutocorrelationReversals(filtData, AvgL);
5 comments
Leave Comment
Please login here to leave a comment.
NICE WORK BROTHER
NICE AFL
Many thanks
How to understand /interpret this? Plz post some guidelines on using this indicator
viswanath
very good !
tks again
hi
Did you look for coding the cmo indicator ?
tks a lot
At least three bars of lag. Not useful for trading. Thanks anyway.