Support Resistant for Amibroker (AFL)
st3v3 about 11 years ago Amibroker (AFL)
This is AFL for Support / Resistant.
Hope it helps
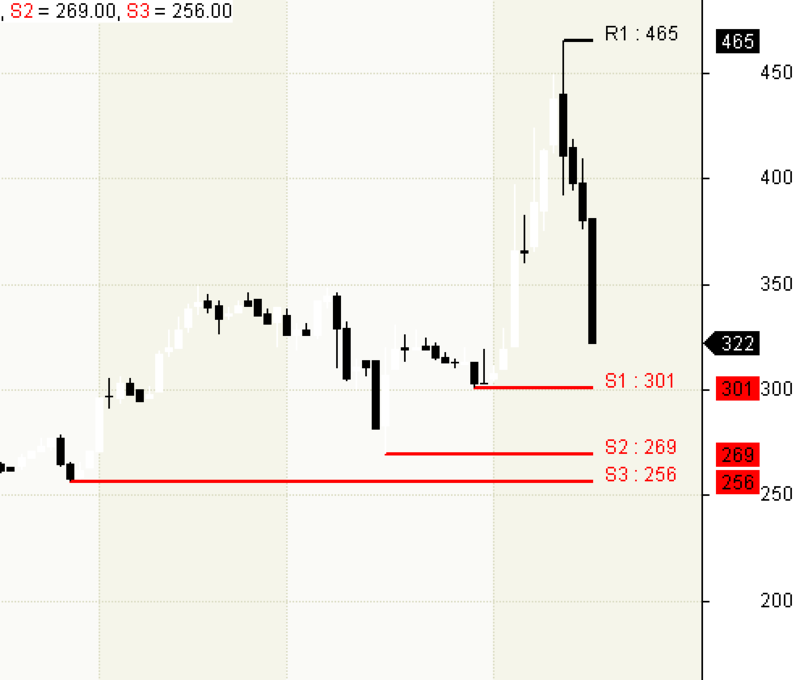
Screenshots
Indicator / Formula
Copy & Paste Friendly
_SECTION_BEGIN("SupportResistance");
// START SCRIPT UNTUK SUPPORT / RESISTANT
// S/R RECODE by Stefanus Wardoyo @6March2014 - stefanus.wardoyo@infinitstudio.com

WarnaResistant = ParamColor("Warna Garis Resistant",colorBlack);
WarnaSupport = ParamColor("Warna Garis Support",colorRed);
R1_show = 0;
S1_show = 0;

SRStyle = ParamStyle("S/R Style",styleThick);

if (ParamToggle("Garis Support&Resistance", "Tidak|Ya", 1 ))
{
	// RESISTANT
	LastHighestValue = LastVisibleValue(Ref(H,-1));
	if (LastVisibleValue(H) == H[LastValue(BarIndex())])
		LastHighestValue = LastVisibleValue(H);

	i = 1;

	if (LastHighestValue < HighestVisibleValue(H))
	{
			while (LastVisibleValue(ValueWhen(H <= Ref(H,-1) AND Ref(H,-2) <= Ref(H, -1),Ref(H, -1), i)) < LastHighestValue)
				i++;

	    	R1 = LastVisibleValue(ValueWhen(H <= Ref(H,-1) AND Ref(H,-2) <= Ref(H, -1),Ref(H, -1), i));

			R1x = LastVisibleValue(ValueWhen(H <= Ref(H,-1) AND Ref(H,-2) <= Ref(H, -1),Ref(BarIndex(), -1), i));
			Plot(IIf(BarIndex() >= R1x,LastValue(R1),Null),"R1",WarnaResistant ,SRStyle);
			PlotText("R1 : " + R1, BarCount + 1, LastValue(R1), WarnaResistant);
			R1_show = 1;

			i++;

			if (HighestVisibleValue( H ) > R1)
			{
				while (LastVisibleValue(ValueWhen(H <= Ref(H,-1) AND Ref(H,-2) <= Ref(H, -1), Ref(H,-1), i)) <= R1)
					i++;

				R2 = LastVisibleValue(ValueWhen(H <= Ref(H,-1) AND Ref(H,-2) <= Ref(H, -1), Ref(H,-1), i));
				R2x = LastVisibleValue(ValueWhen(H <= Ref(H,-1) AND Ref(H,-2) <= Ref(H, -1),Ref(BarIndex(), -1), i));

				Plot(IIf(BarIndex() >= R2x,LastValue(R2),Null),"R2",WarnaResistant ,SRStyle);
				PlotText("R2 : " + R2, BarCount + 1, LastValue(R2), WarnaResistant);
				i++;
				if (HighestVisibleValue( H )> R2)
				{
					while (LastVisibleValue(ValueWhen(H <= Ref(H,-1) AND Ref(H,-2) <= Ref(H, -1), Ref(H,-1), i)) <= R2)
						i++;
					R3 = LastVisibleValue(ValueWhen(H <= Ref(H,-1) AND Ref(H,-2) <= Ref(H, -1), Ref(H,-1), i));
					R3x = LastVisibleValue(ValueWhen(H <= Ref(H,-1) AND Ref(H,-2) <= Ref(H, -1),Ref(BarIndex(), -1), i));

					Plot(IIf(BarIndex() >= R3x,LastValue(R3),Null),"R3",WarnaResistant ,SRStyle);
					PlotText("R3 : " + R3, BarCount + 1, LastValue(R3), WarnaResistant);
				}
			}
	}
	else if (LastHighestValue == HighestVisibleValue(H))
	{
	   	R1 = LastVisibleValue(ValueWhen(H <= Ref(H,-1) AND Ref(H,-2) <= Ref(H, -1),Ref(H, -1), i));
		R1x = LastVisibleValue(ValueWhen(H <= Ref(H,-1) AND Ref(H,-2) <= Ref(H, -1),Ref(BarIndex(), -1), i));
		if (R1 == LastHighestValue)
		{
			Plot(IIf(BarIndex() >= R1x,LastValue(R1),Null),"R1",WarnaResistant ,SRStyle);
			PlotText("R1 : " + R1, BarCount + 1, LastValue(R1), WarnaResistant);
			R1_show = 1;
		}
	}

	// SUPPORT
	LastLowestValue = LastVisibleValue(Ref(L,-1));
	if (LastVisibleValue(L) == L[LastValue(BarIndex())])
		LastLowestValue = LastVisibleValue(L);

	i = 1;

	if (LastLowestValue > LowestVisibleValue(L))
	{
			while (LastVisibleValue(ValueWhen(L >= Ref(L,-1) AND Ref(L,-2) >= Ref(L, -1),Ref(L, -1), i)) > LastLowestValue)
				i++;

			S1 = LastVisibleValue(ValueWhen(L >= Ref(L,-1) AND Ref(L,-2) >= Ref(L, -1),Ref(L, -1), i));
			S1x = LastVisibleValue(ValueWhen(L >= Ref(L,-1) AND Ref(L,-2) >= Ref(L, -1),Ref(BarIndex(), -1), i));
			Plot(IIf(BarIndex() >= S1x,LastValue(S1),Null),"S1",WarnaSupport ,SRStyle);
			PlotText("S1 : " + S1, BarCount + 1, LastValue(S1), WarnaSupport);
			S1_show = 1;
			i++;

			if (LowestVisibleValue( L ) < S1)
			{
				while (LastVisibleValue(ValueWhen(L >= Ref(L,-1) AND Ref(L,-2) >= Ref(L, -1), Ref(L,-1), i)) >= S1)
					i++;

				S2 = LastVisibleValue(ValueWhen(L >= Ref(L,-1) AND Ref(L,-2) >= Ref(L, -1), Ref(L,-1), i));
				S2x = LastVisibleValue(ValueWhen(L >= Ref(L,-1) AND Ref(L,-2) >= Ref(L, -1), Ref(BarIndex(),-1), i));

				Plot(IIf(BarIndex() >= S2x,LastValue(S2),Null),"S2",WarnaSupport ,SRStyle);
				PlotText("S2 : " + S2, BarCount + 1, LastValue(S2), WarnaSupport);
				i++;
				if (LowestVisibleValue( L )< S2)
				{
					while (LastVisibleValue(ValueWhen(L >= Ref(L,-1) AND Ref(L,-2) >= Ref(L, -1), Ref(L,-1), i)) >= S2)
						i++;
					S3 = LastVisibleValue(ValueWhen(L >= Ref(L,-1) AND Ref(L,-2) >= Ref(L, -1), Ref(L,-1), i));
					S3x = LastVisibleValue(ValueWhen(L >= Ref(L,-1) AND Ref(L,-2) >= Ref(L, -1), Ref(BarIndex(),-1), i));
					Plot(IIf(BarIndex() >= S3x,LastValue(S3),Null),"S3",WarnaSupport ,SRStyle);
					PlotText("S3 : " + S3, BarCount + 1, LastValue(S3), WarnaSupport);
				}
			}
	}
	else if (LastLowestValue == LowestVisibleValue(L))
	{
	   	S1 = LastVisibleValue(ValueWhen(L >= Ref(L,-1) AND Ref(L,-2) >= Ref(L, -1),Ref(L, -1), i));
		S1x = LastVisibleValue(ValueWhen(L >= Ref(L,-1) AND Ref(L,-2) >= Ref(L, -1),Ref(BarIndex(), -1), i));
		if (S1 == LastLowestValue)
		{
			Plot(IIf(BarIndex() >= S1x,LastValue(S1),Null),"S1",WarnaSupport ,SRStyle);
			PlotText("S1 : " + S1, BarCount + 1, LastValue(S1), WarnaSupport);
			S1_show = 1;
		}
	}

	if (S1_show AND R1_show)
	{
		SR = Prec((1-(S1/R1))*100,2);
	}
}

// END SCRIPT UNTUK SUPPORT / RESISTANT
_SECTION_END();
0 comments
Leave Comment
Please login here to leave a comment.