MACD beautiful for Amibroker (AFL)
Chaiset almost 11 years ago Amibroker (AFL)
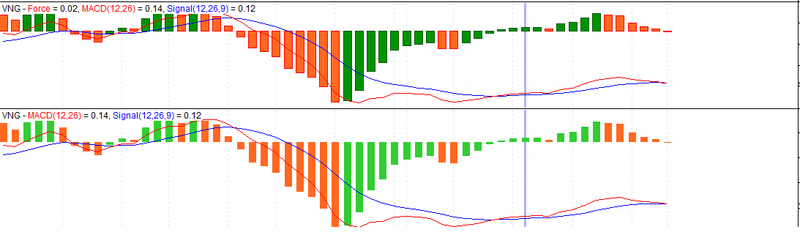
MACD beautiful
Screenshots
Indicator / Formula
Copy & Paste Friendly
_SECTION_BEGIN("MACD beautiful");

r1 = Param( "Fast avg", 12, 2, 200, 1 );
r2 = Param( "Slow avg", 26, 2, 200, 1 );
r3 = Param( "Signal avg", 9, 2, 200, 1 );
ml = MACD(r1, r2);
sl = Signal(r1,r2,r3);
Hitg = ml-sl;
_SECTION_END();
_SECTION_BEGIN(" Color Histogram ");
MACUP = Hitg > Ref(Hitg,-1);
MACDN = Hitg < Ref(Hitg,-1);
HistogramUp = ParamColor("Hist Bar Up", colorGreen);
HistogramDown = ParamColor("Hist Bar Down", colorOrange );
HistUp = ParamColor("Histogram Up", colorDarkGreen);
HistDown = ParamColor("Histogram Down", colorRed );
BarColor = IIf(MACUP,HistogramUp ,IIf(MACDN,HistogramDown,colorBlue));
//BarColor = IIf(Hitg>0,HistogramUp ,HistogramDown);
_SECTION_END();
_SECTION_BEGIN("");
if (ParamToggle("Histogram ","Off|On",1))
{
//Plot( Hitg, "", BarColor , styleHistogram|styleThick|styleOwnScale , Null, Null, 0, 1 , -50 );
SetBarFillColor( BarColor );
PlotOHLC(0,Hitg,0,Hitg,"Force",IIf(MACUP,HistUp ,IIf(MACDN,HistDown,0)), styleCandle | styleOwnScale ) ;
}
_SECTION_END();
_SECTION_BEGIN("");
if (ParamToggle("MACD & Signal","Off|On",1))
{
Plot( ml = MACD(r1, r2), StrFormat(_SECTION_NAME()+"MACD(%g,%g)", r1, r2), ParamColor("MACD Color ", colorRed ), ParamStyle("MACD Style"), Null, Null, 0, 2 );
Plot( sl = Signal(r1,r2,r3),StrFormat(_SECTION_NAME()+"Signal(%g,%g,%g)", r1, r2,r3) , ParamColor("Signal Color ", colorBlue ), ParamStyle("Signal Style"), Null, Null, 0, 2 );
}
_SECTION_END();
4 comments
Leave Comment
Please login here to leave a comment.
thank
Thanks a Ton!! Sir ji.
its working 100%
Prakash Modak
Histogram position is not correct. Please put the histogram position in 0 level. your histogram position is not set on 0 level. Thanks a lot
No Zahir , It is correct. You should read the chart correctly. i appreciate the author