High/Low MA/EMA indicator for Amibroker (AFL)
koyickal over 10 years ago Amibroker (AFL)
Hi folks,
This is a MA/EMA indicator which works on 5 minutes to 1 hour time frame. You need not change any parameter, it will adjust itself.
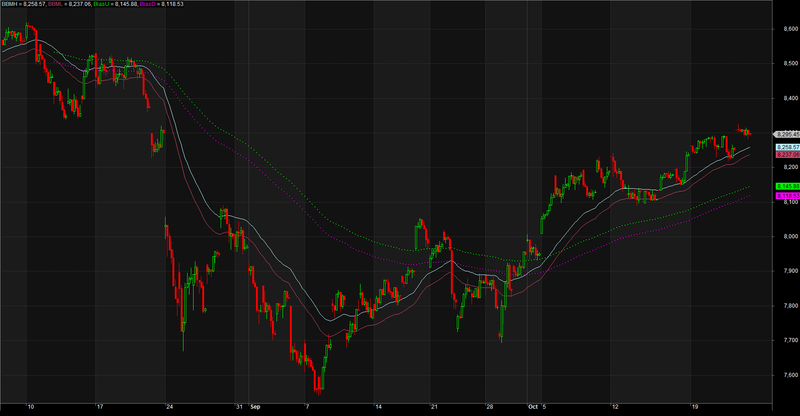
At this point, I haven’t incorporated any buy/sell arrows, but once you see the chart, it will be self explanatory. I made it for Nifty/Banknifty charts, may work on others too.
Bollinger band and 5 day low/high EMAs are inbuilt in this code, you will need to enable them in parameter section to see them. You won’t see them in the screen shot.
The code is a bit of mess now, I will clean it up at later stage along with buy/sell arrows.
Enjoy!
Screenshots
Indicator / Formula
Copy & Paste Friendly
_SECTION_BEGIN("Price");
SetChartOptions(0,chartShowArrows|chartShowDates);
_N(Title = StrFormat("{{VALUES}}", SelectedValue( ROC( C, 1 ) ) ));
Plot( C, "Close", ParamColor("Color", colorDefault ), styleNoTitle | ParamStyle("Style") | GetPriceStyle() );
_SECTION_END();

TF = Interval();
Dayema=Param("dayema",0,0,1);
LT=Param("LT",1,0,1);
BB=Param("BB",0,0,1);

TimeFrameSet (inDaily);
EMA5DH=(EMA(H,5)+(EMA(C,5)*.00375));
EMA5DC=EMA(C,5);
EMA5DL=(EMA(L,5)-(EMA(C,5)*.00375));
TimeFrameRestore();

if (TF==1800) {

	BBML=MA(L,21);
	BBMC=MA(C,21);
	BBMH=MA(H,21);
	UP=EMA(H,69);
	NUTRAL=EMA(C,69);
	DOWN=EMA(L,69);
	Bias=EMA(C,25);
	Plot( BBMC, "BBMC", colorGold );
	Plot (UP, "Up",colorGreen);
	Plot (NUTRAL, "Nutral",colorBlue);
	Plot (DOWN, "Down",colorRed);
//Plot (EMA53C, "ema53C", colorBrightGreen,styleDashed);
	if (dayema == 1) {
		Plot (TimeFrameExpand(EMA5DH,inDaily),"5DH",colorPaleGreen,styleDashed);
		Plot (TimeFrameExpand(EMA5DC,inDaily),"5DH",colorLightBlue,styleDashed);
		Plot (TimeFrameExpand(EMA5DL,inDaily),"5DH",colorOrange,styleDashed);
	}
	if (BB == 1) {
		Plot( BBandTop( C, 21, 2.2 ),"BBTop", colorLightGrey);
		Plot( BBandBot( C, 21, 2.2 ), "BBBot", colorLightGrey);
	}
}


else if (TF==900) {

	BBML=MA(L,21);
	BBMC=MA(C,21);
	BBMH=MA(H,21);
	UP=EMA(H,135);
	NUTRAL=EMA(C,135);
	DOWN=EMA(L,135);
	BiasU=EMA(H,44);
	BiasN=EMA(C,44);
	BiasD=EMA(L,44);
	Plot( BBMH, "BBMH", colorCustom15 );
//Plot( BBMC, "BBMC", colorGold );
	Plot( BBML, "BBML", colorCustom16 );
	Plot (UP, "Up",colorGreen);
//Plot (NUTRAL, "Nutral",colorBlue);
	Plot (DOWN, "Down",colorRed);
	Plot (BiasU, "BiasU", colorCustom9,styleDashed);
//Plot (BiasN, "BiasN", colorCustom11,styleDashed);
	Plot (BiasD, "BiasD", colorCustom12,styleDashed);
	if (dayema == 1) {
		Plot (TimeFrameExpand(EMA5DH,inDaily),"5DH",colorPaleGreen,styleDashed);
		Plot (TimeFrameExpand(EMA5DC,inDaily),"5DH",colorLightBlue,styleDashed);
		Plot (TimeFrameExpand(EMA5DL,inDaily),"5DH",colorOrange,styleDashed);
	}
	if (BB==1) {
		Plot( BBandTop( C, 21, 2.2 ),"BBTop", colorLightGrey);
		Plot( BBandBot( C, 21, 2.2 ), "BBBot", colorLightGrey);
	}
}


else if (TF==600) {

	BBML=MA(L,22);
	BBMC=MA(C,22);
	BBMH=MA(H,22);
	UP=EMA(H,200);
	NUTRAL=EMA(C,200);
	DOWN=EMA(L,200);
	BiasU=EMA(H,67);
	BiasN=EMA(C,67);
	BiasD=EMA(L,67);
	Plot( BBMH, "BBMH", colorCustom15 );
	//Plot( BBMC, "BBMC", colorGold );
	Plot( BBML, "BBML", colorCustom16 );
	Plot (UP, "Up",colorGreen);
	//Plot (NUTRAL, "Nutral",colorBlue);
	Plot (DOWN, "Down",colorRed);
	Plot (BiasU, "BiasU", colorCustom9,styleDashed);
	//Plot (BiasN, "BiasN", colorCustom11,styleDashed);
	Plot (BiasD, "BiasD", colorCustom12,styleDashed);
	if (dayema == 1) {
		Plot (TimeFrameExpand(EMA5DH,inDaily),"5DH",colorPaleGreen,styleDashed);
		Plot (TimeFrameExpand(EMA5DC,inDaily),"5DH",colorLightBlue,styleDashed);
		Plot (TimeFrameExpand(EMA5DL,inDaily),"5DH",colorOrange,styleDashed);
	}
	if (BB==1) {
		Plot( BBandTop( C, 21, 2.2 ),"BBTop", colorLightGrey);
		Plot( BBandBot( C, 21, 2.2 ), "BBBot", colorLightGrey);
	}
}

else if (TF==300) {

	BBML=MA(L,44);
	BBMC=MA(C,44);
	BBMH=MA(H,44);
	UP=EMA(H,385);
	NUTRAL=EMA(C,385);
	DOWN=EMA(L,385);
	BiasU=EMA(H,135);
	BiasN=EMA(C,135);
	BiasD=EMA(L,135);
	Plot( BBMH, "BBMH", colorCustom15 );
	//Plot( BBMC, "BBMC", colorGold );
	Plot( BBML, "BBML", colorCustom16 );
	Plot (UP, "Up",colorGreen);
	//Plot (NUTRAL, "Nutral",colorBlue);
	Plot (DOWN, "Down",colorRed);
	Plot (BiasU, "BiasU", colorCustom9,styleDashed);
	//Plot (BiasN, "BiasN", colorCustom11,styleDashed);
	Plot (BiasD, "BiasD", colorCustom12,styleDashed);
	if (dayema == 1) {
		Plot (TimeFrameExpand(EMA5DH,inDaily),"5DH",colorPaleGreen,styleDashed);
		Plot (TimeFrameExpand(EMA5DC,inDaily),"5DH",colorLightBlue,styleDashed);
		Plot (TimeFrameExpand(EMA5DL,inDaily),"5DH",colorOrange,styleDashed);
	}
	if (BB == 1) {
		Plot( BBandTop( C, 44, 2.3 ),"BBTop", colorLightGrey);
		Plot( BBandBot( C, 44, 2.3 ), "BBBot", colorLightGrey);
	}
}

else if (TF==3600) {

	if (LT == 1) {

		BBML=EMA(L,44);
		BBMC=EMA(C,44);
		BBMH=EMA(H,44);
		UP=EMA(H,375);
		NUTRAL=EMA(C,375);
		DOWN=EMA(L,375);
		BiasU=EMA(H,155);
		BiasN=EMA(C,155);
		BiasD=EMA(L,155);
		Plot( BBMH, "BBMH", colorCustom15 );
		//Plot( BBMC, "BBMC", colorGold );
		Plot( BBML, "BBML", colorCustom16 );
		//Plot (UP, "Up",colorGreen);
		//Plot (NUTRAL, "Nutral",colorBlue);
		//Plot (DOWN, "Down",colorRed);
		Plot (BiasU, "BiasU", colorCustom9,styleDashed);
		//Plot (BiasN, "BiasN", colorCustom11,styleDashed);
		Plot (BiasD, "BiasD", colorCustom12,styleDashed);
		if (dayema == 1) {
			Plot (TimeFrameExpand(EMA5DH,inDaily),"5DH",colorPaleGreen,styleDashed);
			Plot (TimeFrameExpand(EMA5DC,inDaily),"5DH",colorLightBlue,styleDashed);
			Plot (TimeFrameExpand(EMA5DL,inDaily),"5DH",colorOrange,styleDashed);
		}
		if (BB==1) {
			Plot( BBandTop( C, 44, 2.3 ),"BBTop", colorLightGrey);
			Plot( BBandBot( C, 44, 2.3 ), "BBBot", colorLightGrey);
		}
	}
	else {
		UP=EMA(H,40);
		NUTRAL=EMA(C,40);
		DOWN=EMA(L,40);
		Bias=EMA(C,11);
		Plot (UP, "Up",colorGreen);
		Plot (NUTRAL, "Nutral",colorBlue);
		Plot (DOWN, "Down",colorRed);
		//Plot (Bias, "Bias", colorBrightGreen,styleDashed);
		if (BB==1) {
			Plot( BBandTop( C, 20, 2 ),"BBTop", colorLightGrey);
			Plot( BBandBot( C, 20, 2 ), "BBBot", colorLightGrey);
		}
	}
}
6 comments
Leave Comment
Please login here to leave a comment.
BEST RESULT TO ME IN MCX GOLD 5 MINUTE TIME FROM High/Low MA/EMA indicator
I’m sorry I did not understand the essence, you could not explain?
@Atlasraketa,
Dear friend,
The concept is that, once the prices are above high MA/EMA lines, they tend to go up and below low MA/EMA lines, the reverse effect takes place. You need to choose time frame convenient to you. There are multiple MA/EMA lines given in the plot which may work as resistance/support levels. A little bit of observation will help you understand the concept yourself.
Thanks,
koyickal, thank you! I think I understand a little about your idea.
One more question, what show dayema line?
Developers need parameters setting I require few parameters setup for any AFls we use just like drop on any Afl and if i select parameters will control afl.
Like if i say in parameters (intra-day )
than it will close trades by 3.15 and show my open positions to be closed on back testing reports.
Like wise 3 more condition and to help the matter I have written Afls also but you just need to integrate.
Thanks,
Viral
dalalviral@yahoo.com
@Atlasraketa
It’s 5 day low, close and High EMA levels. Once the day closes above 5 Day high EMA, the market said to be trending higher. Closing below low EMA has reverse effect.
Thanks,