VPA Relative Vol for Amibroker (AFL)
sal157011 over 10 years ago Amibroker (AFL)
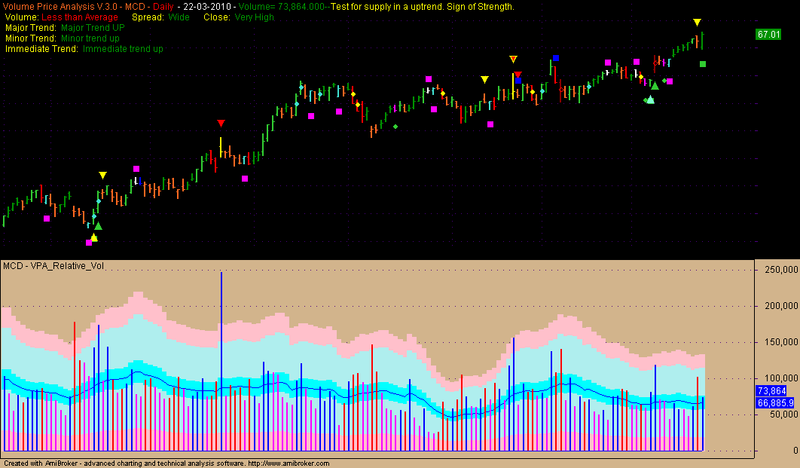
Ultra High, Very High, High, Average, Low, Very low Volume Bands.
Volume Histogram with up bar blue, down bar red, level bar black, volume lower than the volumes of the 2 previous bars pink.
Screenshots
Indicator / Formula
Copy & Paste Friendly
_SECTION_BEGIN("VPA_Relative_Vol");
LBP = Param("Look Back", 15, 0, 100,1 );
V1=IIf(V<=0,MA(V,LBP),V);  //minimize errors on volume data (data <= 0)
Mean = MA(ln(V1),LBP);     // LBP periods moving average of(natural logaritm of( volume))
avvol = exp(mean);         // average volume
VolUnit = avvol/3.5;       // avvol=VolUnit*3.5
// color up bar volume blue, down bar volume red, volume lower than the volumes of the 2 previous bars pink
Clr = IIf(V1<Ref(V1,-1)AND V1<Ref(V1,-2),11,IIf(Close>Ref(Close,-1),29,IIf(Close==Ref(Close,-1),1,32)));

                                    //   Ultra High band
                                    //   Ultra High band
                                    //   Ultra High band
VeryHighBand = avvol + VolUnit*3.5;// 7 ----------------
                                    //   Very High band
HighBand = avvol + VolUnit*2.5;    // 6 ----------------
                                    //   High band
                                    //   High band
AvgBandHigh = avvol + VolUnit/2;   // 4 ----------------
//------------------------------------ 3.5 Average band
AvgBandLow = avvol - VolUnit/2;    // 3 ----------------
                                    //   Low band
                                    //   Low band
LowBand = avvol - VolUnit*2.5;     // 1 ----------------
                                    //   Very low band
//-------------------------------------0-----------------
Plot(exp(ln(V1)),"",Clr,6); // plot Volume Histogram
Plot(avvol,"",29,1);// plot average volume
Plot(0,"",29,1|4096); // plot 0 volume
Plot(LowBand,"",40,styleArea|1|4096);
Plot(AvgBandLow,"",52,styleArea|1|4096);
Plot(AvgBandHigh,"",10,styleArea|1|4096);
Plot(HighBand,"",52,styleArea|1|4096);
Plot(VeryHighBand,"",40,styleArea|1|4096);

_SECTION_END();
2 comments
Leave Comment
Please login here to leave a comment.
super
great work!