Simple Triple Moving Average Crossover for Amibroker (AFL)
thangnd.1211 over 10 years ago Amibroker (AFL)
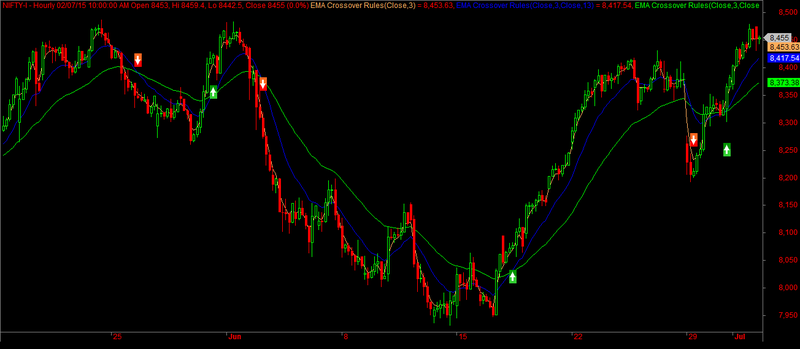
Here is the very simple and classical example to build a triple EMA (Exponential Moving Average Crossover system). System is quite popular if anyone (trader/investor) is a newbie to classical technical analysis. In this AFL the triple moving average buy, sell signals are coded and comes with Scanning and Exploration functionality.
It is a simple trend following system where the system shows buy signal if 3 EMA > 13 EMA > 34 EMA and shows a sell signal if 3 EMA < 13 EMA < 34 EMA. It works good in a trending market. When a stock/index is not trending (when it’s going sideways) the moving averages will intermingle and repeatedly crisscross each other especially during the consolidation phase. A Trader can take advantage during this phase and can use this indicator to trade the next move.
However like any other trend following system this system too has its own disadvantages. Catches signals very late, sometimes at the peak. And it could withstand the noise in a sideways market to some extend avoiding multiple whipsaws compared to a double moving average crossover system.
Screenshots
Indicator / Formula
_SECTION_BEGIN("Price");
SetChartOptions(0,chartShowArrows|chartShowDates);
_N(Title = StrFormat("{{NAME}} - {{INTERVAL}} {{DATE}} Open %g, Hi %g, Lo %g, Close %g (%.1f%%) {{VALUES}}", O, H, L, C, SelectedValue( ROC( C, 1 ) ) ));
Plot( C, "Close", ParamColor("Color", colorDefault ), styleNoTitle | ParamStyle("Style") | GetPriceStyle() );
_SECTION_END();


_SECTION_BEGIN("Triple EMA Crossover Rules");

P1 = ParamField("Price field",-1);
Periods1 = Param("Periods1", 3, 2, 300, 1, 10 );
Plot( EMA( P1, Periods1 ), _DEFAULT_NAME(), ParamColor( "Color1", colorCycle ), ParamStyle("Style1") );

P2 = ParamField("Price field",-1);
Periods2 = Param("Periods2", 13, 2, 300, 1, 10 );
Plot( EMA( P2, Periods2 ), _DEFAULT_NAME(), ParamColor( "Color2", colorCycle ), ParamStyle("Style2") );

P3 = ParamField("Price field",-1);
Periods3 = Param("Periods3", 34, 2, 300, 1, 10 );
Plot( EMA( P3, Periods3 ), _DEFAULT_NAME(), ParamColor( "Color3", colorCycle ), ParamStyle("Style3") );


Buy = EMA(P1, Periods1) > EMA(P2, Periods2) AND EMA(P2, Periods2) > EMA(P3, Periods3);
Sell = EMA(P1, Periods1) < EMA(P2, Periods2) AND EMA(P2, Periods2) < EMA(P3, Periods3);

Buy = ExRem(Buy,Sell);
Sell = ExRem(Sell,Buy);


Filter=Buy OR Sell;
SetOption("NoDefaultColumns", True );
AddColumn( DateTime(), "Date", formatDateTime );
AddColumn( IIf( Buy, 66, 83 ), "Signal", formatChar );
addcolumn( Close, "Close price", 1.4 );


PlotShapes(IIf(Buy, shapeSquare, shapeNone),colorGreen, 0, L, Offset=-40);
PlotShapes(IIf(Buy, shapeSquare, shapeNone),colorLime, 0,L, Offset=-50);
PlotShapes(IIf(Buy, shapeUpArrow, shapeNone),colorWhite, 0,L, Offset=-45);
PlotShapes(IIf(Sell, shapeSquare, shapeNone),colorRed, 0, H, Offset=40);
PlotShapes(IIf(Sell, shapeSquare, shapeNone),colorOrange, 0,H, Offset=50);
PlotShapes(IIf(Sell, shapeDownArrow, shapeNone),colorWhite, 0,H, Offset=-45);

_SECTION_END();
0 comments
Leave Comment
Please login here to leave a comment.