DEMA Fan AFL for Amibroker (AFL)
doss186 over 10 years ago Amibroker (AFL)
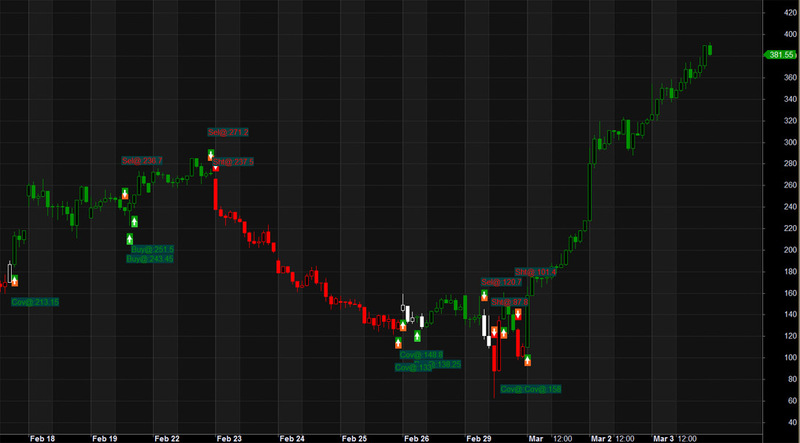
This is a DEMA FAN system, check how it works…
Screenshots
Indicator / Formula
Copy & Paste Friendly
SetChartOptions(0,chartShowArrows|chartShowDates);

_SECTION_BEGIN("DEMA BUY");
Cond1 = DEMA(  Close , 5 ) > DEMA(  Open , 36 );
Cond2 = DEMA(  Close , 7 ) > DEMA(  Open , 36 );
Cond3 = DEMA(  Close , 9 ) > DEMA(  Open , 36 );
Cond4 = DEMA(  Close , 11 ) > DEMA(  Open , 36 );
Cond5 = DEMA(  Close , 13 ) >  DEMA(  Open , 36 );

Cond6= DEMA(  Close , 5 ) < DEMA(  Open , 21 );
Cond7= DEMA(  Close , 7 ) < DEMA(  Open , 21 );
Cond8= DEMA(  Close , 9 ) < DEMA(  Open , 21 );
Cond9= DEMA(  Close , 11 ) < DEMA(  Open , 21 );
Cond10= DEMA(  Close , 13 ) < DEMA(  Open , 21 );

Buy =  Cond1 AND Cond2 AND Cond3 AND Cond4 AND Cond5;
Sell =  Cond6 AND Cond7 AND Cond8 AND Cond9 AND Cond10;

Buy=ExRem(Buy,Sell);
Sell=ExRem(Sell,Buy);

PlotShapes(IIf(Buy, shapeSquare, shapeNone),colorGreen, 0, L, Offset=-20);
PlotShapes(IIf(Buy, shapeSquare, shapeNone),colorLime, 0,L, Offset=-30);
PlotShapes(IIf(Buy, shapeUpArrow, shapeNone),colorWhite, 0,L, Offset=-25);
PlotShapes(IIf(Sell, shapeSquare, shapeNone),colorOrange, 0, H, Offset=20);
PlotShapes(IIf(Sell, shapeSquare, shapeNone),colorGreen, 0,H, Offset=30);
PlotShapes(IIf(Sell, shapeDownArrow, shapeNone),colorWhite, 0,H, Offset=-25);


dist = 3*ATR(10);
dist1 = 3*ATR(10);
for( i = 0; i < BarCount; i++ )
{
 if( Buy[i] )
 {
  PlotText( "\nBuy@:" + C[ i ], i, C[ i ]-dist[i], colorGreen, colorDarkOliveGreen );
 }
 if( Sell[i] )
 {
  PlotText( "Sel@:" + C[ i ], i, C[ i ]+dist1[i], colorRed, colorDarkOliveGreen );
 }

}
 _SECTION_END();

 _SECTION_BEGIN("DEMA SELL");

Cond11 = DEMA(  Close , 5 ) < DEMA(  Open , 36 );
Cond12 = DEMA(  Close , 7 ) < DEMA(  Open , 36 );
Cond13 = DEMA(  Close , 9 ) < DEMA(  Open , 36 );
Cond14 = DEMA(  Close , 11 ) < DEMA(  Open , 36 );
Cond15 = DEMA(  Close , 13 ) < DEMA(  Open , 36 );


Cond16= DEMA(  Close , 5 ) > DEMA(  Open , 21 );
Cond17= DEMA(  Close , 7 ) > DEMA(  Open , 21 );
Cond18= DEMA(  Close , 9 ) > DEMA(  Open , 21 );
Cond19= DEMA(  Close , 11 ) > DEMA(  Open , 21 );
Cond20= DEMA(  Close , 13 ) > DEMA(  Open , 21 );

Buy =  Cond16 AND Cond17 AND Cond18 AND Cond19 AND Cond20;
Sell =  Cond11 AND Cond12 AND Cond13 AND Cond14 AND Cond15;

Buy=ExRem(Buy,Sell);
Sell=ExRem(Sell,Buy);

PlotShapes(IIf(Buy, shapeSquare, shapeNone),colorGreen, 0, L, Offset=-20);
PlotShapes(IIf(Buy, shapeSquare, shapeNone),colorOrange, 0,L, Offset=-30);
PlotShapes(IIf(Buy, shapeUpArrow, shapeNone),colorWhite, 0,L, Offset=-25);
PlotShapes(IIf(Sell, shapeSquare, shapeNone),colorRed, 0, H, Offset=20);
PlotShapes(IIf(Sell, shapeSquare, shapeNone),colorOrange, 0,H, Offset=30);
PlotShapes(IIf(Sell, shapeDownArrow, shapeNone),colorWhite, 0,H, Offset=-25);

dist = 3*ATR(10);
dist1 = 3*ATR(10);
for( i = 0; i < BarCount; i++ )
{
 if( Buy[i] )
 {
  PlotText( "\nCov@:" + C[ i ], i, C[ i ]-dist[i], colorGreen, colorDarkOliveGreen );
 }
 if( Sell[i] )
 {
  PlotText( "Sht@:" + C[ i ], i, C[ i ]+dist1[i], colorRed, colorDarkOliveGreen );
 }

}

 _SECTION_END();

 _SECTION_BEGIN("DEMA COLOR");

Cond1 = DEMA(  Close , 5 ) > DEMA(  Open , 36 );
Cond2 = DEMA(  Close , 7 ) > DEMA(  Open , 36 );
Cond3 = DEMA(  Close , 9 ) > DEMA(  Open , 36 );
Cond4 = DEMA(  Close , 11 ) > DEMA(  Open , 36 );
Cond5 = DEMA(  Close , 13 ) >  DEMA(  Open , 36 );

Cond11 = DEMA(  Close , 5 ) < DEMA(  Open , 36 );
Cond12 = DEMA(  Close , 7 ) < DEMA(  Open , 36 );
Cond13 = DEMA(  Close , 9 ) < DEMA(  Open , 36 );
Cond14 = DEMA(  Close , 11 ) < DEMA(  Open , 36 );
Cond15 = DEMA(  Close , 13 ) < DEMA(  Open , 36 );

CondA=  Cond1 AND Cond2 AND Cond3 AND Cond4 AND Cond5;
CondB=  Cond11 AND Cond12 AND Cond13 AND Cond14 AND Cond15;
BarColor  = IIf(CondA,colorGreen,IIf(CondB,colorRed,colorWhite));

Plot( C, "Close", BarColor, styleNoTitle | ParamStyle("Style") |
GetPriceStyle() );

GraphXSpace=10;

 _SECTION_END();
0 comments
Leave Comment
Please login here to leave a comment.