Probability Density & Gaussian Distribution for Amibroker (AFL)
kaiji over 16 years ago Amibroker (AFL)
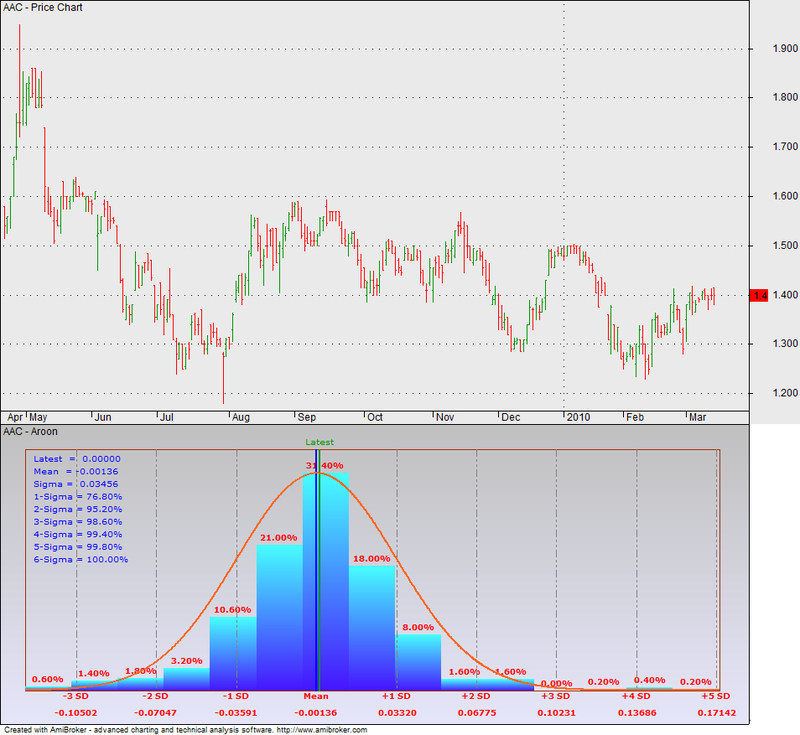
Plots a custom graph of the probability distribution of the log returns independent of Amibroker’s chart time scale. Many thanks to Adheer Pai for this cool contribution.
Adheer Pai (adheer at gmail dot com)
Screenshots
You cannot view the code for the following reasons:
- You must be a member.
15 comments
Leave Comment
Please login here to leave a comment.
why the AFL is not working on my chart?
appear the words:
Value: 0000
if (nCount> = 100) numOfStDevs = 100;
)
CurrLineX = pxMargin + (SERIES (nBarIndex]
- – - – - – - – - – - – - – - – - ^
ERROR 10.
Subscript out of range.Not acces aray elements
outside 0 .. (BarCount-1) range.
Help Me Please.
Hi chynthia I have looked over the error and the code and you should not get that error. It simply should not be possible for that line of code to cause the error. How are you applying the formula onto and existing chart or a clean and empty one? Also are you applying it to intraday day data? Its strange that you get an error for that line and not 178.
YES I WAS ALSO GETTING THESE ERRORS THAT SRCIPT IS GETTING OUT OF RANGE N
SOLUTION TO THIS PROBLEM IS
FOR EOD BASIS TURN UR CHARTS TO WEEKLY OR MONTHLY BASIS RATHER THAN DAILY BASIS N IT WORKS FINE
FOR INRADAY I ASSUME IF U TURN IT TO MORE THAN 15 MINS OR 30 MINS BAR THAN IT WILL WORK FINE
ENJOY THIS GREAT CEARTION GUYS VERY RARE PIECE OF AFL
THANKS FOR SHARING
Hello guys,
I was just going through this afl, can some one tell me how to trade intraday with this afl.
i see a green line moving from left to write on a 1 minute chart if i check each candle mean shows max for today 48% mini 36%,
Can some one help me with this afl how to use the afl to trade?
Thanks
Alok
Alok its open to a wide variety of interpretation i’d imagine if the green line is above the mean its a bullish sign and if its bellow the mean its a bearish sign.
there is no chart display
Hi I have tried but no chart is displayed. What version of amibroker does this run.
Mikey
5.30
this is one code for archiving in your library…excellent.
Dear administrator, please little explain once how to read this afl and what is meaning of mean if you can tell -regards
“Identify whether the series exhibits normal Gaussian distribution”
Sorry I can’t be of much help.
nice! tnx
Very nice piece of code, thanks for sharing!
Work Properly, thanks
very nice, bro!