ULTIMATE VOLATILITY EXPERT V.3 for Amibroker (AFL)
Muralikrishna about 10 years ago Amibroker (AFL)
Hi Friends,
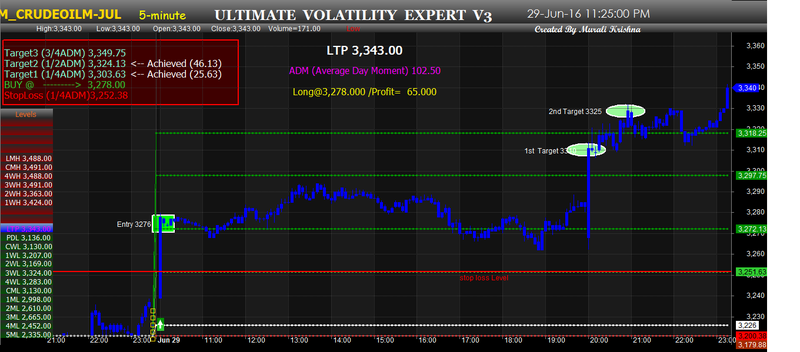
This is ULTIMATE VOLATILITY TRADING SYSTEM’s upgrade version. including More Features. Like everyday fresh signals and Target Stop loss levels dash board etc.In this system full focused for Intraday Trading.
Trade Idea: *Entry with Buy Sell Signals.
- Target And Stop loss : above left side window dashboard text.
- Text shows signals + 3 Target points + stop loss Points
and when price achieved these levels intimate with text massages too.
*Most Confident that the first and second targets are achieved. So Trade Multi lots for good profits.
Ex. Some Lots exit 1st Target and some Lots exit 2nd Target
Note:
- Don’t trade end of the day last hours. forget it last 1, 2 hours signals.
- Must exit your all trades in the same day.
*strict maintain strategy for stop loss and target points.
leave your valuable comments and suggestions here.
Thanks,
Murali krishna
krishna.vaastu@gmail.com
Screenshots
Indicator / Formula
Copy & Paste Friendly
_SECTION_BEGIN("Price");

SetChartOptions(0,chartShowArrows|chartShowDates);
SetChartBkColor(ParamColor("bkcolor",ColorRGB(0,0, 0)));
//SetTradeDelays(1,1,1,1);
SetPositionSize(100,spsShares);
_SECTION_END();

NDays=Param("Number of Days",10,1,100,1);
DayC=TimeFrameGetPrice("C",inDaily,-1);
NDaysDHLAvg=0;
for(i=1;i<=NDays;i++)
{
	DayH=TimeFrameGetPrice("H",inDaily,-i);
	DayL=TimeFrameGetPrice("L",inDaily,-i);
	NDaysDHLAvg=NDaysDHLAvg+(DayH-DayL);
}
NDaysDHLAvg=NDaysDHLAvg/NDays;

ADM= NDaysDHLAvg;   // Average Day Moment

// Dynamic Levels//----------Majer Support Resistent Zones---------------------------------------------------

DayH = 	TimeFrameGetPrice("H", inDaily, -1);	   		DayHI = LastValue (DayH,1); 		// yesterdays high
DayL = 	TimeFrameGetPrice("L", inDaily, -1);	 		DayLI = LastValue (DayL,1);			// yesterdays low
DayC = 	TimeFrameGetPrice("C", inDaily, -1);	 		DayCI = LastValue (DayC,1);			// yesterdays close
DayO = 	TimeFrameGetPrice("O", inDaily);				DayOI = LastValue (DayO,1);			// current day open
WeekH= 	TimeFrameGetPrice("H", inWeekly, 0);     		WeekHI = LastValue (WeekH,1); 		// This Week  high
WeekL= 	TimeFrameGetPrice("L", inWeekly, 0);     		WeekLI = LastValue (WeekL,1); 		// This Week  low
MonthH= 	TimeFrameGetPrice("H", inMonthly, 0);   		MonthHI = LastValue (MonthH,1); 	// This Month  high
MonthL= 	TimeFrameGetPrice("L", inMonthly, 0);  		MonthLI = LastValue (MonthL,1); 	// This Month  low
LWeekH= 	TimeFrameGetPrice("H", inWeekly, -1);   		LWeekHI = LastValue (LWeekH,1);  	// One Week before high
LWeekL= 	TimeFrameGetPrice("L", inWeekly, -1);   		LWeekLI = LastValue (LWeekL,1);  	// One Week before low
LMonthH= 	TimeFrameGetPrice("H", inMonthly, -1); 		LMonthHI = LastValue (LMonthH,1); 	// One Month before high
LMonthL= 	TimeFrameGetPrice("L", inMonthly, -1); 		LMonthLI = LastValue (LMonthL,1); 	// One Month before low
L1WeekH= 	TimeFrameGetPrice("H", inWeekly, -2);  		L1WeekHI = LastValue (L1WeekH,1); 	// Two Week before high
L1WeekL= 	TimeFrameGetPrice("L", inWeekly, -2);  		L1WeekLI = LastValue (L1WeekL,1); 	// Two Week before low
L1MonthH= 	TimeFrameGetPrice("H", inMonthly, -2);		L1MonthHI = LastValue (L1MonthH,1);	// Two Month before high
L1MonthL= 	TimeFrameGetPrice("L", inMonthly, -2); 		L1MonthLI = LastValue (L1MonthL,1);	// Two Month before low
L2WeekH= 	TimeFrameGetPrice("H", inWeekly, -3);   		L2WeekHI = LastValue (L2WeekH,1);  	// Three Week before high
L2WeekL= 	TimeFrameGetPrice("L", inWeekly, -3);   		L2WeekLI = LastValue (L2WeekL,1);  	// Three Week before low
L2MonthH= 	TimeFrameGetPrice("H", inMonthly, -3); 		L2MonthHI = LastValue (L2MonthH,1);	// Three Month before high
L2MonthL= 	TimeFrameGetPrice("L", inMonthly, -3); 		L2MonthLI = LastValue (L2MonthL,1);  	// Three Month before low
L3MonthH= 	TimeFrameGetPrice("H", inMonthly, -4); 		L3MonthHI = LastValue (L3MonthH,1);  	// Four Month before high
L3MonthL= 	TimeFrameGetPrice("L", inMonthly, -4);  		L3MonthLI = LastValue (L3MonthL,1); 	// Four Month before low
L4MonthH= 	TimeFrameGetPrice("H", inMonthly, -5);  		L4MonthHI = LastValue (L4MonthH,1); 	// Five Month before high
L4MonthL= 	TimeFrameGetPrice("L", inMonthly, -5);  		L4MonthLI = LastValue (L4MonthL,1); 	// Five Month before low
L3WeekH= 	TimeFrameGetPrice("H", inWeekly, -4);    		L3WeekHI = LastValue (L3WeekH,1); 	// Four Week before high
L3WeekL= 	TimeFrameGetPrice("L", inWeekly, -4);   		L3WeekLI = LastValue (L3WeekL,1); 	// Four Week before low
//----------------------------------------------------------------------------------------------------------------------


Buy= C>(DayC+(0.25*ADM));
Sell= C<(DayC-(0.25*ADM));

BuyPrice=ValueWhen(Buy,C);
SellPrice=ValueWhen(Sell,C);

BuyTarget1= (0.25*ADM)+BuyPrice;
BuyTarget2= (0.45*ADM)+BuyPrice;
BuyTarget3= (0.90*ADM)+BuyPrice;
BuyStopLoss= BuyPrice-(0.25*ADM);
SellTarget1= SellPrice-(0.25*ADM);
SellTarget2= SellPrice-(0.45*ADM);
SellTarget3= SellPrice-(0.90*ADM);
SellStopLoss= SellPrice+(0.25*ADM);

LastBar = Day() != Ref(Day(),1);

Cover=C<BuyStopLoss OR LastBar ;
Short=C>SellStopLoss OR LastBar;

ShortPrice=ValueWhen(Short,C);
CoverPrice=ValueWhen(Cover,C);

Buy=ExRem(Buy,Cover);
Cover=ExRem(Cover,Buy);
Sell=ExRem(Sell,Short);
Short=ExRem(Short,Sell);

Long=Flip(Buy,Cover);
Shrt=Flip(Sell,Short);

//------------------------------------------------------------------------------------------------

PlotShapes(IIf(Buy, shapeSquare, shapeNone),colorGreen, 0, L, Offset=-40);
PlotShapes(IIf(Buy, shapeSquare, shapeNone),colorLime, 0,L, Offset=-50);
PlotShapes(IIf(Buy, shapeUpArrow, shapeNone),colorWhite, 0,L, Offset=-45);
PlotShapes(IIf(Sell, shapeSquare, shapeNone),colorRed, 0, H, Offset=40);
PlotShapes(IIf(Sell, shapeSquare, shapeNone),colorOrange, 0,H, Offset=50);
PlotShapes(IIf(Sell, shapeDownArrow, shapeNone),colorWhite, 0,H, Offset=-45);

PlotShapes(IIf(Cover, shapeHollowSmallSquare, shapeNone),colorGold, 0, C, Offset=0);
PlotShapes(IIf(Short, shapeHollowSmallSquare, shapeNone),colorGold, 0, C, Offset=0);
PlotShapes(IIf(Cover, shapeHollowSmallSquare, shapeNone),colorGold, 0, C, Offset=-12);
PlotShapes(IIf(Short, shapeHollowSmallSquare, shapeNone),colorGold, 0, C, Offset=12);
PlotShapes(IIf(Cover, shapeHollowSmallSquare, shapeNone),colorGold, 0, C, Offset=-24);
PlotShapes(IIf(Short, shapeHollowSmallSquare, shapeNone),colorGold, 0, C, Offset=24);

PlotShapes(IIf(Cover, shapeHollowSmallSquare, shapeNone),colorGold, 0, O, Offset=0);
PlotShapes(IIf(Short, shapeHollowSmallSquare, shapeNone),colorGold, 0, O, Offset=0);
PlotShapes(IIf(Cover, shapeHollowSmallSquare, shapeNone),colorGold, 0, O, Offset=12);
PlotShapes(IIf(Short, shapeHollowSmallSquare, shapeNone),colorGold, 0, O, Offset=-12);
PlotShapes(IIf(Cover, shapeHollowSmallSquare, shapeNone),colorGold, 0, O, Offset=24);
PlotShapes(IIf(Short, shapeHollowSmallSquare, shapeNone),colorGold, 0, O, Offset=-24);


Long=Flip(Buy,Sell);
Shrt=Flip(Sell,Buy);

BuyPrice=ValueWhen(Buy,C);
SellPrice=ValueWhen(Sell,C);

Bdc=(
WriteIf (Buy AND Ref(shrt,-1), " BUY@ "+C+"  ","")+
WriteIf(Buy  , "LastTrade Profit="+(SellPrice-C)+"","")
);

Sdc=(
WriteIf (Sell AND Ref(Long,-1), " SEll@ "+C+"  ","")+
WriteIf(Sell , "LastTrade Profit="+(C-BuyPrice)+"","")
);

Ndc=(
WriteIf(Long AND NOT Buy, "Long@"+WriteVal((BuyPrice))+" /Profit="+WriteVal((C-BuyPrice))+"","")+
WriteIf(Shrt AND NOT Sell, "Short@"+WriteVal((SellPrice))+" /Profit="+WriteVal((SellPrice-C))+"","")
);

if (EndValue(Buy)==1) Say("Buy Trigged, Mr. Krishna, Buy some lots");
if (EndValue(Sell)==1) Say("Sell Trigged, Mr. Krishna, Sell some lots");
_SECTION_END();

trendup = IIf(C>((DayC)+((.25)*(ADM))), colorBlue, colorWhite);
trendcolor = IIf(C<((DayC)-((.25)*(ADM))), colorRed, trendup);
Plot( C, "Close", trendcolor, styleCandle | styleThick );

numbars = LastValue(Cum(Status("barvisible")));
hts  = -33.5;

// Volatility Levels //
DC =    DayC;                         DCI = LastValue (DC,1);     // Yesterday Close
BY  =  ((DayC)+((0.25)*(ADM)));       BYI = LastValue (BY,1);     // +1/4 ADM
BT1  =  ((DayC)+((0.45)*(ADM)));      BT1I = LastValue (BT1,1);   // +1/2 ADM
BT2  =  ((DayC)+((0.70)*(ADM)));      BT2I = LastValue (BT2,1);   // +3/4 ADM
BT3  =  ((DayC)+(0.90*ADM));          BT3I = LastValue (BT3,1);   // +1 ADM
SH  =  ((DayC)-((0.25)*(ADM)));       SHI = LastValue (SH,1);     // -1/4 ADM
ST1  =  ((DayC)-((0.45)*(ADM)));      ST1I = LastValue (ST1,1);   // -1/2 ADM
ST2  =  ((DayC)-((0.70)*(ADM)));      ST2I = LastValue (ST2,1);   // -3/4 ADM
ST3 =  ((DayC)-(0.90*ADM));           ST3I = LastValue (ST3,1);   // -1 ADM

vvl = ParamToggle("Intraday Target Levels","Hide|Show",1);
if(vvl==1)  {
  Plot(DC, "DC",colorWhite,styleDots|styleLine|styleNoRescale|styleNoTitle);
  Plot(BY, "BY",colorLime,styleDots|styleLine|styleNoRescale|styleNoTitle);
  Plot(BT1, "BT1",colorGreen,styleDots|styleLine|styleNoRescale|styleNoTitle);
  Plot(BT2, "BT2",colorGreen,styleDots|styleLine|styleNoRescale|styleNoTitle);
  Plot(BT3, "BT3",colorGreen,styleDots|styleLine|styleNoRescale|styleNoTitle);
  Plot(SH, "SH",colorRed,styleDots|styleLine|styleNoRescale|styleNoTitle);
  Plot(ST1, "ST1",colorBrown,styleDots|styleLine|styleNoRescale|styleNoTitle);
  Plot(ST2, "ST2",colorBrown,styleDots|styleLine|styleNoRescale|styleNoTitle);
  Plot(ST3, "ST3",colorBrown,styleDots|styleLine|styleNoRescale|styleNoTitle);

  PlotText(" PreviousDay Close  ",  LastValue(BarIndex())-(numbars/Hts), DCI, colorWhite);
  PlotText(" 1/4ADM " ,    LastValue(BarIndex())-(numbars/Hts), BYI, colorLime);
  PlotText(" 1/2ADM " ,    LastValue(BarIndex())-(numbars/Hts), BT1I, colorGreen);
  PlotText(" 3/4ADM " ,    LastValue(BarIndex())-(numbars/Hts), BT2I, colorGreen);
  PlotText(" 1ADM " ,    LastValue(BarIndex())-(numbars/Hts), BT3I, colorGreen);
  PlotText(" 1/4ADM " ,    LastValue(BarIndex())-(numbars/Hts), SHI, colorRed);
  PlotText(" 1/2ADM " ,    LastValue(BarIndex())-(numbars/Hts), ST1I, colorBrown);
  PlotText(" 3/4ADM " ,    LastValue(BarIndex())-(numbars/Hts), ST2I, colorBrown);
  PlotText(" 1ADM " ,    LastValue(BarIndex())-(numbars/Hts), ST3I, colorBrown);
}

mmwwl = ParamToggle(" MOnthly, Weekly Levels","Hide|Show",0);
if(mmwwl==1)  {
  Plot(DayH, "PDH",colorBlue,styleLine|styleNoRescale|styleNoTitle);
  Plot(WeekH, "CWH",colorBlue,styleLine|styleNoRescale|styleNoTitle);
  Plot(LWeekH, "LWH",colorBlue,styleLine|styleNoRescale|styleNoTitle);
  Plot(L1WeekH, "2WH",colorBlue,styleLine|styleNoRescale|styleNoTitle);
  Plot(L2WeekH, "3WH",colorBlue,styleLine|styleNoRescale|styleNoTitle);
  Plot(L3WeekH, "4WH",colorBlue,styleLine|styleNoRescale|styleNoTitle);
  Plot(MonthH, "CMH",colorBlue,styleLine|styleNoRescale|styleNoTitle);
  Plot(LMonthH, "LMH",colorBlue,styleLine|styleNoRescale|styleNoTitle);
  Plot(L1MonthH, "2MH",colorBlue,styleLine|styleNoRescale|styleNoTitle);
  Plot(L2MonthH, "3MH",colorBlue,styleLine|styleNoRescale|styleNoTitle);
  Plot(L3MonthH, "4MH",colorBlue,styleLine|styleNoRescale|styleNoTitle);
  Plot(L4MonthH, "5MH",colorBlue,styleLine|styleNoRescale|styleNoTitle);

  Plot(DayL, "PDL",colorViolet,styleLine|styleNoRescale|styleNoTitle);
  Plot(WeekL, "CWL",colorViolet,styleLine|styleNoRescale|styleNoTitle);
  Plot(LWeekL, "LWL",colorViolet,styleLine|styleNoRescale|styleNoTitle);
  Plot(L1WeekL, "2WL",colorViolet,styleLine|styleNoRescale|styleNoTitle);
  Plot(L2WeekL, "3WL",colorViolet,styleLine|styleNoRescale|styleNoTitle);
  Plot(L3WeekL, "4WL",colorViolet,styleLine|styleNoRescale|styleNoTitle);
  Plot(MonthL, "CML",colorViolet,styleLine|styleNoRescale|styleNoTitle);
  Plot(LMonthL, "LML",colorViolet,styleLine|styleNoRescale|styleNoTitle);
  Plot(L1MonthL, "2ML",colorViolet,styleLine|styleNoRescale|styleNoTitle);
  Plot(L2MonthL, "3ML",colorViolet,styleLine|styleNoRescale|styleNoTitle);
  Plot(L3MonthL, "4ML",colorViolet,styleLine|styleNoRescale|styleNoTitle);
  Plot(L4MonthL, "5ML",colorViolet,styleLine|styleNoRescale|styleNoTitle);

  PlotText(" PDH ",  	LastValue(BarIndex())-(numbars/Hts), DayHI, colorBlue);
  PlotText(" CWH " ,    LastValue(BarIndex())-(numbars/Hts), WeekHI, colorBlue);
  PlotText(" LWH " ,    LastValue(BarIndex())-(numbars/Hts), LWeekHI, colorBlue);
  PlotText(" 2WH " ,    LastValue(BarIndex())-(numbars/Hts), L1WeekHI, colorBlue);
  PlotText(" 3WH " ,    LastValue(BarIndex())-(numbars/Hts), L2WeekHI, colorBlue);
  PlotText(" 4WH " ,    LastValue(BarIndex())-(numbars/Hts), L3WeekHI, colorBlue);
  PlotText(" CMH " ,    LastValue(BarIndex())-(numbars/Hts), MonthHI, colorBlue);
  PlotText(" LMH " ,    LastValue(BarIndex())-(numbars/Hts), LMonthHI, colorBlue);
  PlotText(" 2MH " ,    LastValue(BarIndex())-(numbars/Hts), L1MonthHI, colorBlue);
  PlotText(" 3MH ",  	LastValue(BarIndex())-(numbars/Hts), L2MonthHI, colorBlue);
  PlotText(" 4MH " ,    LastValue(BarIndex())-(numbars/Hts), L3MonthHI, colorBlue);
  PlotText(" 5MH " ,    LastValue(BarIndex())-(numbars/Hts), L4MonthHI, colorBlue);

  PlotText(" PDL " ,    LastValue(BarIndex())-(numbars/Hts), DayLI, colorViolet);
  PlotText(" CWL " ,    LastValue(BarIndex())-(numbars/Hts), WeekLI, colorViolet);
  PlotText(" LWL " ,    LastValue(BarIndex())-(numbars/Hts), LWeekLI, colorViolet);
  PlotText(" 2WL " ,    LastValue(BarIndex())-(numbars/Hts), L1WeekLI, colorViolet);
  PlotText(" 3WL " ,    LastValue(BarIndex())-(numbars/Hts), L2WeekLI, colorViolet);
  PlotText(" 4WL " ,    LastValue(BarIndex())-(numbars/Hts), L3WeekLI, colorViolet);
  PlotText(" CML " ,    LastValue(BarIndex())-(numbars/Hts), MonthLI, colorViolet);
  PlotText(" LML " ,    LastValue(BarIndex())-(numbars/Hts), LMonthLI, colorViolet);
  PlotText(" 2ML " ,    LastValue(BarIndex())-(numbars/Hts), L1MonthLI, colorViolet);
  PlotText(" 3ML ",  	LastValue(BarIndex())-(numbars/Hts), L2MonthLI, colorViolet);
  PlotText(" 4ML " ,    LastValue(BarIndex())-(numbars/Hts), L3MonthLI, colorViolet);
  PlotText(" 5ML " ,    LastValue(BarIndex())-(numbars/Hts), L4MonthLI, colorViolet);

}

_SECTION_BEGIN("Background text");
C11=ParamColor("up panel",colorBlack );
C12=ParamColor("dn panel",colorBlack );
C13=Param("fonts",20,10,30,1 );
C14=Param("left-right",2.1,1.0,5.0,0.1 );
C15=Param("up-down",8,1,30,1 );
Miny = Status("axisminy");
Maxy = Status("axismaxy");
lvb = Status("lastvisiblebar");
fvb = Status("firstvisiblebar");
pxwidth = Status("pxwidth");
pxheight = Status("pxheight");
GfxSetBkMode( 0 );
GfxSelectFont("Tahoma", 12, 500, False, False, 0);
GfxSetTextColor(colorCustom12);
GfxSetTextAlign( 6 );
GfxTextOut( "ADM (Average Daily Movement) "+WriteVal(ADM,1.2), Status("pxwidth")/C14, Status("pxheight")/C15*1.5);
GfxSelectFont("Tahoma", 15, 600, False, False, 0);
GfxSetTextColor(colorWhite);
GfxSetTextAlign( 6 );
GfxTextOut( "LTP "+WriteVal(C,1.2), Status("pxwidth")/C14, Status("pxheight")/C15);
GfxSelectFont("Tahoma", 12, 400, False, False, 0);
GfxSetTextColor(colorBrightGreen);
GfxTextOut(""+Bdc+"", Status("pxwidth")/C14, Status("pxheight")/C15*2.0);
GfxSelectFont("Tahoma", 12, 400, False, False, 0);
GfxSetTextColor(colorRed);
GfxTextOut(""+Sdc+"", Status("pxwidth")/C14, Status("pxheight")/C15*2.0);
GfxSelectFont("Tahoma", 12, 400, False, False, 0);
GfxSetTextColor(colorYellow);
GfxTextOut(""+Ndc+"", Status("pxwidth")/C14, Status("pxheight")/C15*2.0);
GfxSelectFont("Tahoma", 12, 400, False, False, 0);
GfxSetTextColor(colorGreen);

pricechange=(C-Ref(C,-1))*100/Ref(C,-1);
changeponit=C-Ref(C,-1);
Vlp=Param("Volume lookback period",15,10,300,10);
Vrg=MA(V,Vlp);
St = StDev(Vrg,Vlp);
Vp3 = Vrg + 3*st;
Vp2 = Vrg + 2*st;;
Vp1 = Vrg + 1*st;;
Vn1 = Vrg -1*st;
Vn2 = Vrg -2*st;

x=Param("xposn",1,0,1000,1);
y=Param("yposn",1,0,1000,1);

GfxGradientRect( 1, 1, 1400, 40, colorGrey50, colorDarkGrey);
GfxSetBkMode(0);
GfxSelectFont( "Georgia", 18, 800, False );
GfxSetTextColor( colorWhite );
GfxTextOut( "ULTIMATE  VOLATILITY  EXPERT  V3", x+600, y+10 );
GfxSelectFont( "Tahoma", 16, 800, False );
GfxSetTextColor( colorGold );
GfxTextOut( Name(), x+100, y+10 );
GfxSelectFont( "Century Gothic", 15, 100, False );
GfxSetTextColor( colorWhite );
GfxTextOut( Date(), x+1000, y+10 );
GfxSelectFont( "Comic Sans MS", 15, 500, False );
GfxSetTextColor( colorYellow );
GfxTextOut( Interval(2), x+275, y+10 );
//------------------------------------------------------------ H, L, O, C----------------------
GfxGradientRect( 1, 40, 1400, 55, colorGrey50, colorDarkGrey );
GfxSetBkMode(0);
GfxSelectFont( "Areal", 9, 200, False );
GfxSetTextColor( colorWhite );
GfxTextOut( "High:"+WriteVal(H,1.2), x+100, y+40 );
GfxSelectFont( "Areal", 9, 200, False );
GfxSetTextColor( colorWhite );
GfxTextOut( "Low:"+WriteVal(L,1.2), x+200, y+40 );
GfxSelectFont( "Areal", 9, 200, False );
GfxSetTextColor( colorWhite );
GfxTextOut( "Open:"+WriteVal(O,1.2), x+300, y+40 );
GfxSelectFont( "Areal", 9, 200, False );
GfxSetTextColor( colorWhite );
GfxTextOut( "Close:"+WriteVal(C,1.2), x+400, y+40 );
GfxSelectFont( "Script MT Bold", 12, 100, False );
GfxSetTextColor( colorWhite );
GfxTextOut( "Created By Murali Krishna ", x+1000, y+39 );
//-----------------------------------------------------------Valume-------------------------------
GfxSelectFont( "Tahoma", 9, 200, False );
GfxSetTextColor( colorWhite );
GfxTextOut( "Volume="+WriteVal(V,1.2), x+500, y+40 );
GfxSelectFont( "Tahoma", 9, 200, False );
GfxSetTextColor( colorLime );
GfxTextOut( WriteIf(V>Vp2,"Very High",""), x+600, y+40 );
GfxSelectFont( "Tahoma", 9, 200, False );
GfxSetTextColor( colorLime );
GfxTextOut( WriteIf(V>Vp1," High",""), x+600, y+40 );
GfxSelectFont( "Tahoma", 9, 200, False );
GfxSetTextColor( colorLime );
GfxTextOut( WriteIf(V>Vrg,"Above Average",""), x+600, y+40 );
GfxSelectFont( "Tahoma", 9, 200, False );
GfxSetTextColor( colorRed );
GfxTextOut( WriteIf(V<Vrg AND V>Vn1,"Less than Average",""), x+600, y+40 );
GfxSelectFont( "Tahoma", 9, 200, False );
GfxSetTextColor( colorRed );
GfxTextOut( WriteIf(V<Vn1,"Low",""), x+600, y+40 );
//----------------------------------------------------------------Leveles----------------------------

GfxGradientRect( 1, 185, 90, 200, colorGrey50,colorDarkGrey );
GfxSetBkMode(0);
GfxSelectFont( "Tahoma", 10, 300, False );
GfxSetTextColor( colorOrange );
GfxTextOut( "Levels ", x+45, y+185 );

GfxGradientRect( 1, 200, 90, 215, colorDarkGrey,colorDarkRed );
GfxSetBkMode(0);
GfxSelectFont( "Tahoma", 10, 300, False );
GfxSetTextColor( colorWhite );
GfxTextOut( WriteIf (L4MonthH>C, " 5MH "+WriteVal(L4MonthH,1.2)+"  ",""), x+50, y+200 );

GfxGradientRect( 1, 215, 90, 230, colorDarkGrey, colorDarkRed );
GfxSetBkMode(0);
GfxSelectFont( "Tahoma", 10, 300, False );
GfxSetTextColor( colorWhite );
GfxTextOut( WriteIf (L3MonthH>C, " 4MH "+WriteVal(L3MonthH,1.2)+"  ",""), x+50, y+215 );

GfxGradientRect( 1, 230, 90, 245, colorDarkGrey, colorDarkRed );
GfxSetBkMode(0);
GfxSelectFont( "Tahoma", 10, 300, False );
GfxSetTextColor( colorWhite );
GfxTextOut( WriteIf (L2MonthH>C, " 3MH "+WriteVal(L2MonthH,1.2)+"  ",""), x+50, y+230 );

GfxGradientRect( 1, 245, 90, 260, colorDarkGrey, colorDarkRed );
GfxSetBkMode(0);
GfxSelectFont( "Tahoma", 10, 300, False );
GfxSetTextColor( colorWhite );
GfxTextOut( WriteIf (L1MonthH>C, " 2MH "+WriteVal(L1MonthH,1.2)+"  ",""), x+50, y+245 );

GfxGradientRect( 1, 260, 90, 275, colorDarkGrey, colorDarkRed );
GfxSetBkMode(0);
GfxSelectFont( "Tahoma", 10, 300, False );
GfxSetTextColor( colorWhite );
GfxTextOut( WriteIf (LMonthH>C, " LMH "+WriteVal(LMonthH,1.2)+"  ",""), x+50, y+260 );

GfxGradientRect( 1, 275, 90, 290, colorDarkGrey, colorDarkRed );
GfxSetBkMode(0);
GfxSelectFont( "Tahoma", 10, 300, False );
GfxSetTextColor( colorWhite );
GfxTextOut( WriteIf (MonthH>C, " CMH "+WriteVal(MonthH,1.2)+"  ",""), x+50, y+275 );

GfxGradientRect( 1, 290, 90, 305, colorDarkGrey, colorDarkRed );
GfxSetBkMode(0);
GfxSelectFont( "Tahoma", 10, 300, False );
GfxSetTextColor( colorWhite );
GfxTextOut( WriteIf (L3WeekH>C, " 4WH "+WriteVal(L3WeekH,1.2)+"  ",""),x+50, y+290 );

GfxGradientRect( 1, 305, 90, 320, colorDarkGrey, colorDarkRed );
GfxSetBkMode(0);
GfxSelectFont( "Tahoma", 10, 300, False );
GfxSetTextColor( colorWhite );
GfxTextOut( WriteIf (L2WeekH>C, " 3WH "+WriteVal(L2WeekH,1.2)+"  ",""), x+50, y+305 );

GfxGradientRect( 1, 320, 90, 335, colorDarkGrey, colorDarkRed );
GfxSetBkMode(0);
GfxSelectFont( "Tahoma", 10, 300, False );
GfxSetTextColor( colorWhite );
GfxTextOut( WriteIf (L1WeekH>C, " 2WH "+WriteVal(L1WeekH,1.2)+"  ",""), x+50, y+320 );

GfxGradientRect( 1, 335, 90, 350, colorDarkGrey, colorDarkRed );
GfxSetBkMode(0);
GfxSelectFont( "Tahoma", 10, 300, False );
GfxSetTextColor( colorWhite );
GfxTextOut( WriteIf (LWeekH>C, " 1WH "+WriteVal(LWeekH,1.2)+"  ","") , x+50, y+335 );

GfxGradientRect( 1, 350, 90, 365, colorDarkGrey, colorDarkRed );
GfxSetBkMode(0);
GfxSelectFont( "Tahoma", 10, 300, False );
GfxSetTextColor( colorWhite );
GfxTextOut( WriteIf (WeekH>C, " CWH "+WriteVal(WeekH,1.2)+"  ",""), x+50, y+350 );

GfxGradientRect( 1, 365, 90, 380, colorDarkGrey, colorDarkRed );
GfxSetBkMode(0);
GfxSelectFont( "Tahoma", 10, 300, False );
GfxSetTextColor( colorWhite );
GfxTextOut( WriteIf (DayH>C, " PDH "+WriteVal(DayH,1.2)+"  ",""), x+50, y+365 );

GfxGradientRect( 1, 380, 90, 395, colorLightBlue , colorBlue );
GfxSetBkMode(0);
GfxSelectFont( "Tahoma", 10, 300, False );
GfxSetTextColor( colorCustom12);
GfxTextOut( WriteIf (C, " LTP "+WriteVal(C,1.2)+"  ",""), x+50, y+380 );

GfxGradientRect( 1, 395, 90, 410, colorDarkGrey,colorDarkGreen);
GfxSetBkMode(0);
GfxSelectFont( "Tahoma", 10, 300, False );
GfxSetTextColor( colorWhite );
GfxTextOut( WriteIf (DayL<C, " PDL "+WriteVal(DayL,1.2)+"  ",""), x+50, y+395 );

GfxGradientRect( 1, 410, 90, 425, colorDarkGrey, colorDarkGreen );
GfxSetBkMode(0);
GfxSelectFont( "Tahoma", 10, 300, False );
GfxSetTextColor( colorWhite );
GfxTextOut( WriteIf (WeekL<C, " CWL "+WriteVal(WeekL,1.2)+"  ",""), x+50, y+410 );

GfxGradientRect( 1, 425, 90, 440, colorDarkGrey, colorDarkGreen );
GfxSetBkMode(0);
GfxSelectFont( "Tahoma", 10, 300, False );
GfxSetTextColor( colorWhite );
GfxTextOut( WriteIf (LWeekL<C, " 1WL "+WriteVal(LWeekL,1.2)+"  ",""), x+50, y+425 );

GfxGradientRect( 1, 440, 90, 455, colorDarkGrey, colorDarkGreen );
GfxSetBkMode(0);
GfxSelectFont( "Tahoma", 9, 300, False );
GfxSetTextColor( colorWhite );
GfxTextOut( WriteIf (L1WeekL<C, " 2WL "+WriteVal(L1WeekL,1.2)+"  ",""), x+50, y+440);

GfxGradientRect( 1, 455, 90, 470, colorDarkGrey, colorDarkGreen );
GfxSetBkMode(0);
GfxSelectFont( "Tahoma", 10, 300, False );
GfxSetTextColor( colorWhite );
GfxTextOut( WriteIf (L2WeekL<C, " 3WL "+WriteVal(L2WeekL,1.2)+"  ",""), x+50, y+455);

GfxGradientRect( 1, 470, 90, 485, colorDarkGrey, colorDarkGreen );
GfxSetBkMode(0);
GfxSelectFont( "Tahoma", 10, 300, False );
GfxSetTextColor( colorWhite );
GfxTextOut( WriteIf (L3WeekL<C, " 4WL "+WriteVal(L3WeekL,1.2)+"  ",""), x+50, y+470);

GfxGradientRect( 1, 485, 90, 500, colorDarkGrey, colorDarkGreen );
GfxSetBkMode(0);
GfxSelectFont( "Tahoma", 10, 300, False );
GfxSetTextColor( colorWhite );
GfxTextOut( WriteIf (MonthL<C, " CML "+WriteVal(MonthL,1.2)+"  ",""), x+50, y+485);

GfxGradientRect( 1, 500, 90, 515, colorDarkGrey, colorDarkGreen );
GfxSetBkMode(0);
GfxSelectFont( "Tahoma", 10, 300, False );
GfxSetTextColor( colorWhite );
GfxTextOut( WriteIf (LMonthL<C, " 1ML "+WriteVal(LMonthL,1.2)+"  ",""), x+50, y+500);

GfxGradientRect( 1, 515, 90, 530, colorDarkGrey, colorDarkGreen );
GfxSetBkMode(0);
GfxSelectFont( "Tahoma", 10, 300, False );
GfxSetTextColor( colorWhite );
GfxTextOut( WriteIf (L1MonthL<C, " 2ML "+WriteVal(L1MonthL,1.2)+"  ",""), x+50, y+515);

GfxGradientRect( 1, 530, 90, 545, colorDarkGrey, colorDarkGreen );
GfxSetBkMode(0);
GfxSelectFont( "Tahoma", 10, 300, False );
GfxSetTextColor( colorWhite );
GfxTextOut( WriteIf (L2MonthL<C, " 3ML "+WriteVal(L2MonthL,1.2)+"  ",""), x+50, y+530);

GfxGradientRect( 1, 545, 90, 560, colorDarkGrey, colorDarkGreen );
GfxSetBkMode(0);
GfxSelectFont( "Tahoma", 10, 300, False );
GfxSetTextColor( colorWhite );
GfxTextOut( WriteIf (L3MonthL<C, " 4ML "+WriteVal(L3MonthL,1.2)+"  ",""), x+50, y+545);

GfxGradientRect( 1, 560, 90, 575, colorDarkGrey, colorDarkGreen );
GfxSetBkMode(0);
GfxSelectFont( "Tahoma", 10, 300, False );
GfxSetTextColor( colorWhite );
GfxTextOut( WriteIf (L4MonthL<C, " 5ML "+WriteVal(L4MonthL,1.2)+"  ",""), x+50, y+560);

//----------------------------------ADM Based Targets Achieved Text ------------------------------------------------------------

BuyTarget1= (0.25*ADM)+BuyPrice;
BuyTarget2= (0.45*ADM)+BuyPrice;
BuyTarget3= (0.70*ADM)+BuyPrice;
BuyStopLoss= BuyPrice-(0.25*ADM);
SellTarget1= SellPrice-(0.25*ADM);
SellTarget2= SellPrice-(0.45*ADM);
SellTarget3= SellPrice-(0.70*ADM);
SellStopLoss= SellPrice+(0.25*ADM);

//----------------------------------------------------------------Signals and Targets----------------------------

GfxSelectFont( "Tahoma", 13, 300, False );
GfxSetTextAlign( 0 );
GfxSetTextColor( colorAqua );
GfxTextOut( WriteIf (Long AND NOT Buy, " Target3 (3/4ADM) "+WriteVal(BuyTarget3,1.2)+"  ",""), x+1, y+78);

GfxSelectFont( "Tahoma", 13, 300, False );
GfxSetTextAlign( 0 );
GfxSetTextColor( colorAqua );
GfxTextOut( WriteIf (Long AND NOT Buy, " Target2 (1/2ADM) "+WriteVal(BuyTarget2,1.2)+"  ",""), x+1, y+96);

GfxSelectFont( "Tahoma", 13, 300, False );
GfxSetTextAlign( 0 );
GfxSetTextColor( colorAqua );
GfxTextOut( WriteIf (Long AND NOT Buy, " Target1 (1/4ADM) "+WriteVal(BuyTarget1,1.2)+"  ",""), x+1, y+114);

GfxSelectFont( "Tahoma", 13, 300, False );
GfxSetTextAlign( 0 );
GfxSetTextColor( colorLime );
GfxTextOut( WriteIf (Long AND NOT Buy, " BUY @   --------->  "+WriteVal(BuyPrice,1.2)+"  ",""), x+1, y+132);

GfxSelectFont( "Tahoma", 13, 300, False );
GfxSetTextAlign( 0 );
GfxSetTextColor( colorRed );
GfxTextOut( WriteIf (Long AND NOT Buy, " StopLoss (1/4ADM)"+WriteVal(BuyStopLoss,1.2)+"  ",""), x+1, y+150);

GfxSelectFont( "Tahoma", 13, 300, False );
GfxSetTextAlign( 0 );
GfxSetTextColor( colorLime );
GfxTextOut( WriteIf (Shrt AND NOT Sell, " StopLoss (1/4ADM)"+WriteVal(SellStopLoss,1.2)+"  ",""), x+1, y+60);

GfxSelectFont( "Tahoma", 13, 300, False );
GfxSetTextAlign( 0 );
GfxSetTextColor( colorRed );
GfxTextOut( WriteIf (Shrt AND NOT Sell, " SELL @   ---------> "+WriteVal(SellPrice,1.2)+"  ",""), x+1, y+78);

GfxSelectFont( "Tahoma", 13, 300, False );
GfxSetTextAlign( 0 );
GfxSetTextColor( colorOrange );
GfxTextOut( WriteIf (Shrt AND NOT Sell, " Target1 (1/4ADM)"+WriteVal(SellTarget1,1.2)+"  ",""), x+1, y+96);

GfxSelectFont( "Tahoma", 13, 300, False );
GfxSetTextAlign( 0 );
GfxSetTextColor( colorOrange );
GfxTextOut( WriteIf (Shrt AND NOT Sell, " Target2 (1/2ADM)"+WriteVal(SellTarget2,1.2)+"  ",""), x+1, y+114);

GfxSelectFont( "Tahoma", 13, 300, False );
GfxSetTextAlign( 0 );
GfxSetTextColor( colorOrange );
GfxTextOut( WriteIf (Shrt AND NOT Sell, " Target3 (3/4ADM)"+WriteVal(SellTarget3,1.2)+"  ",""), x+1, y+132);

//----------------------------------------------------------------Achieved Targets and Stl----------------------------

GfxSelectFont( "Tahoma", 13, 300, False );
GfxSetTextAlign( 0 );
GfxSetTextColor( colorWhite );
GfxTextOut( WriteIf (Long AND NOT Buy AND BuyTarget1<C AND NOT Sell AND NOT Shrt, "<-- Achieved ("+(WriteVal(BuyTarget1-BuyPrice,1.2))+")  ",""), x+220, y+114);

GfxSelectFont( "Tahoma", 13, 300, False );
GfxSetTextAlign( 0 );
GfxSetTextColor( colorWhite );
GfxTextOut( WriteIf (Long AND NOT Buy AND BuyTarget2<C AND NOT Sell AND NOT Shrt, "<-- Achieved ("+(WriteVal(BuyTarget2-BuyPrice,1.2))+")  ",""), x+220, y+96);

GfxSelectFont( "Tahoma", 13, 300, False );
GfxSetTextAlign( 0 );
GfxSetTextColor( colorWhite );
GfxTextOut( WriteIf (Long AND NOT Buy AND BuyTarget3<C AND NOT Sell AND NOT Shrt, "<-- Achieved ("+(WriteVal(BuyTarget3-BuyPrice,1.2))+")  ",""), x+220, y+78);

GfxSelectFont( "Tahoma", 13, 300, False );
GfxSetTextAlign( 0 );
GfxSetTextColor( colorYellow );
GfxTextOut( WriteIf (Shrt AND NOT Sell AND SellTarget1>C AND NOT Buy AND NOT Long, "<-- Achieved ("+(WriteVal(SellPrice-SellTarget1,1.2))+")  ",""), x+220, y+96);

GfxSelectFont( "Tahoma", 13, 300, False );
GfxSetTextAlign( 0 );
GfxSetTextColor( colorYellow );
GfxTextOut( WriteIf (Shrt AND NOT Sell AND SellTarget2>C AND NOT Buy AND NOT Long, "<-- Achieved ("+(WriteVal(SellPrice-SellTarget2,1.2))+")  ",""), x+220, y+114);

GfxSelectFont( "Tahoma", 13, 300, False );
GfxSetTextAlign( 0 );
GfxSetTextColor( colorYellow );
GfxTextOut( WriteIf (Shrt AND NOT Sell AND SellTarget3>C AND NOT Buy AND NOT Long, "<-- Achieved("+(WriteVal(SellPrice-SellTarget3,1.2))+")  ",""), x+220, y+132);

GfxSelectFont( "Tahoma", 13, 300, False );
GfxSetTextAlign( 0 );
GfxSetTextColor( colorRed );
GfxTextOut( WriteIf (Long AND NOT Buy AND BuyStopLoss>C AND NOT Sell AND NOT Shrt, "<-- StPls Hit Exit Trade("+(WriteVal(BuyStopLoss-BuyPrice,1.2))+")  ",""), x+220, y+150);

GfxSelectFont( "Tahoma", 13, 300, False );
GfxSetTextAlign( 0 );
GfxSetTextColor( colorRed );
GfxTextOut( WriteIf (Shrt AND NOT Sell AND SellStopLoss<C AND NOT Buy AND NOT Long, "<-- StPls Hit Exit Trade("+WriteVal(SellPrice-SellStopLoss,1.2)+")  ",""), x+220, y+60);
//----------------------------------------------------------------------------------------------------------------------------------------------------------------------------
40 comments
Leave Comment
Please login here to leave a comment.
Dear admin, thank u very much
friends use only 5 , 10 , 15 minute time frames.not sutable for hourly Tfm.
just for trade examples see this blog http://tradeany.blogspot.in/
Dear admin
Thanks a lot
@murali krisha, Thank you very much
@Murali Krishna Sir ,
Excellent work done.
nothing displaying…….only blank chart……..i m using amibroker 6.0
yes same thing I am using ami 5.7 and only black candle show no buy sell signal show please solve this problem
My view :
1. Superb work done
2. Back Testing on 15 min charts, across variety of Future stocks and indices give +ve returns
3. DrawDowns are huge, more than 100 % of net profits
(For example: Bank nifty, 15 min, this calendar year, Net profit of 57 K, Draw down 200 K)
4. BackTest does not provide for multiple exits as explained in blog. So the above results are not as per trading system design
dear sir,
so hard work you done thank you very much
its there any possible in this afl system robo trade for my nest software it so helpful
and i can calculate your formula in crude 25 point top to bottom that mean tomorrow buy sell signal i identify in same day so you can create that line also
thank you
k.suresh
9841365611
chennai
GUYS PLEASE TELL ME WHICH VERSION OF AMI YOU HAVE TO WORK THIS AFL I HAVE A AMI 5.7 AND IT SHOW ONLY GREY BARS NOT SHOWN BUY SELL SIGNAL OR ANY SETTING REQUIRED PLEASE HELP ME
@1100nokia
I’ll try what you asked about, until calculate that levels using by today’s price closing point . ex: today’s close+ 1/4(ADM)= tomorrow Buy level, today’s close- 1/4(ADM)= tomorrow sell level.
@muhammadasad
i think the problem is your data , this system calculates the data for at least ten days. if ur data below 10 days it will not provide any signals, but one solution here go to parameters change Number of Days value modify 10 to 5, Then the signals are found.
thanks for reply after parameter change problem is solved and please tell me one thing if value change in parameter it effect on buy sell signal
yes it is, value change in parameter it effect on buy sell signal levels,The higher the number of days the results are consistent with the values of ADM, Therefore, if possible, make sure that your data is more. but no problem back test it first ur parameter value if it is good after fallow it.
Hi muralikrishna u did great work in this afl.
can you please help me/ guide me how to fire this orders from Amibroker to Zerodha Pi.
i have enable Zerodha Pi Bridge.
zerodha give me some code how to add scrip details or zerodha user details.
iam not expert in code. thatswhy im asking here.
please help me. you did complex work in above AFL, so u can crack my need easily.
im sharing here some links of Zerodha Pi bridge.
what my need is, Amibroker AFL buy sell signals should execute in Pi.
like your afl is showing buy sell signals.
but i dont know what i have to write in AFL, and where i paste that code in AFL.
please sir help me.
Pi Bridge – Bridging All Platforms…
Pi Bridge for Amibroker…
Pi bridge – gateway to trade using other programs…
Modify this AFL to send buy sell orders to Pi code…
@ sadik shaik
mail me
One of the best intraday trading systems, i have ever seen
Lot of hard work behind in this, great salute to Murali sir
Keep going…. !!! God Bless you
not good ,, very mix
Sir, u did really great job. Thank you very much. you must have put so much of your efforts on this, how many days it took for you to create this? just curiously asking.
my only doubt is that is this one repaint? I saw it through backtesting,i did not find any signal repaints! Just need confirmation from you as you are the creator of this. is this one really 100% non repainting strategy?
Thank you.
@rdy087
Yes this is really 100% non repainting strategy, this is levels breaking system so when price breakout the levels then signal stands ,so our trade entry after signal candle(next candle).
dear sir can you check this afl your style more advance easier
http://www.stockbangladesh.com/blog/zig-zag-indicator-with-valid-entry-and-exit-points/
Dear Murali,
Thanks a lot. EXCELLENT.
Regards
Anand
ranking No 1 for this formula, nice hard work murali
Dear Murali,
Beautiful work done.. Thanks for sharing..
SIR EXCELLENT CODE AWESOME… 10STARS PLEASE ADD EMAIL ALERT AND SOUND ALERT…
hi sir nice work, really this is ultimate …….
pls add sms to phone ……
Dear Murali,
This indicator is exceptionally good.
I am planning to use this for Intraday automated trading.
I want to update the code with trailing stop losses.
Ex: For Buy trade,
1.initial stop loss will be BuyStopLoss
2. If close of a candle reaches first target, modify BuyStopLoss to BuyPrice
3. If close of a candle reaches Second target, modify BuyStopLoss to First targetPrice
4. If close of a candle reaches Third target, modify BuyStopLoss to SecondtargetPrice
5. Exit trade at 3-20 PM
Similar strategy for Short position.
If you have code for this, can you post it here.
Rajesh
RAJESH
WHICH TIME FRAME FOR CRUDE ,BNF,NIFTY
@Rahul, I am using 5 Min time frame for Nifty/BNF/Stocks
@Rajesh
yes this q asked more people , I’m already trying to making about it, it will do a lot and satisfy me after that post here soon.
thanks,
murali krishna
MuraliKrishna Thanks a lot for your efforts. Once you post the new AFL with dynamic stoplos, please post the link here. If your time permits, please mail me the afl to rajeshreddyrrgmail.comhello where is download link?
Use the “Copy & Paste Friendly” link
Hi Administrator, How to know/view latest indicators posted by a particular user?
@rajesh438 unfortunately no.
@MuraliKrishna, We are eagerly waiting for an updated AFL with Trailing Stoploss.
In above AFL, SELL is treated as an entry on downside, But as for Amibroker standards SELL is treated as Buy Exit and SHORT is treated as Short entry.
Due to this Back-testing results are not dependable/reliable.
If Possible, Please correct this in new AFL.
Rajesh
Hi MuraliKrishna,
Firstly would like to Congratulate you for your commendable efforts.I think it would have taken you months, if not years, to write such a detailed working code.
Your afl is suitable for commodity trading, where main 4 -5 scripts can be monitored on a daily basis and traded but How about opening some opportunities for equity markets.
My suggestion would be to add an exploration based on Eod data and use the filtered scripts for intraday trading the next day as it would be impossible to trade all nifty 500/200/100 or even 50 stocks simultaneously.
Frankly I tried to add exploration and got a list of scripts mixed with new and old trades (trades which could have been taken 2 or 3 days ago).
plus the addition as Mr. Rajesh pointed out, pls consider.
is this possible or we just have to stick to major known stocks and trade accordingly.
Samson
friends, Thanks to your suggestions.
All my efforts are underway to bring the results of even greater in our AFL . so It will be some delay. Because I can’t perfect write afl codes but trying sincierly and getting more help with respected sir Em. Potasch . My sincerely thanks to u sir .
.
Okay, friends I understand your spirit. I’ve posted a sample of code(beta) in Indicator Pastie .
see it up and send ur suggestions.
thanks,
Murali krishna
@MuraliKrishna, Kudos for your great work and helping nature of yours.
Thanks a lot for posting beta version in pasties.
I tested with couple of scripts, Trailstoploss points are working fine.
Few suggestions based on my observation
1. Make ADM multiplier as an input parameter. Currently 0.25 is the factor used, We can make it as a parameter and use multiplier for targets and stoploss. Ex: if 0.25 is the parameter set by user, 1*0.25 is for entry, 2*0.25 is first target, 3*0.25 is second target and so on
2. When a stoploss(Sell or cover) is hit and again if stock rebounds, the entry point is moved to first target price, plz change it to original entry price.
Ex: 5 mins CenturyTex(on nov 16 2016 with 0.3*ADM) got first entry point at 777.9(12:25 PM), stoploss hit at 763(1:00 PM). Again stock rebounds, this time Entry Buy signal came at 795.4(1:40 PM).
I feel after stock rebounded from any point, the entry should be at 777.9 instead of 795.4
3.If possible give an option to user for setting INTRADAY start time and end times.
Ex: If i want to avoid initial 15 mins volatility, i might need to set trade start time as 092000 and end time 151500. Can be customizable.
If there is any confusion in my suggestions, please post a comment. I will try my best to clear your confusions.
I know you must working hard to implement other enhancements as well.
Thanks,
Rajesh
one thing i always find missing in afls is Total Net Profit for N days, where N is number of days. If we can have a toggle in parameters where we can enter (N) number of days to see total net profit.
If we want to see last 10 days net profit, we can enter 10 in N in parameter. If we want to see for 1 month (20 working days) we can enter 20 in N to see net profit for entire month.
If anyone can help with this i would be thankful in advance.
sir, why i dont get any signal on 1min, 15mins and 5 mins, but i get signal on daily.. can u help me? if i change parameters to 1day it’s work.. but is there any different between 1 day or 10 days in parameters? and when i change to 1 day parameters, it’s give buy signal and no sell signal.
It seems that the formula references FUTURE quotes.
If you backtest this system you may receive outstanding results
that CAN NOT be reproduced in real trading.
???