Intraday 15min TM for Amibroker (AFL)
chethanu about 10 years ago Amibroker (AFL)
Dear Member,
Please use this AFL for intraday ONLY.
use in 15 min time frame.
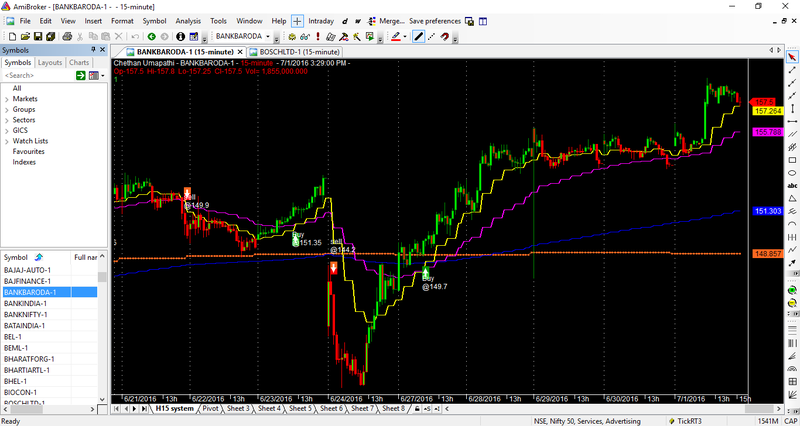
Buy signal – you will get automated buy signal, however the catch is you will buy only when you get above blue line
Sell signal – you will get automated sell signal, you will sell only when you get below blue line
Let me know your thoughts
Regards,
Chethan
Screenshots
Indicator / Formula
Copy & Paste Friendly
_SECTION_BEGIN("Price");
//SetChartBkColor( colorBlack );
_N(Title = StrFormat("{{NAME}} - {{INTERVAL}} {{DATE}} Open %g, Hi %g, Lo %g, Close %g (%.1f%%) {{VALUES}}", O, H, L, C, SelectedValue( ROC( C, 1 ) ) ));

Col_1 = IIf(EMA(RSI(39),30) > Ref(EMA(RSI(39),30),-1),colorGreen,colorRed);
//Plot( C, "", col_1, styleCandle);

Plot(C,"",Col_1,64);


TimeFrameSet( inHourly );
a1 = EMA( C,5);
TimeFrameRestore();
Plot( TimeFrameExpand( a1, inHourly ), " H1", colorYellow,style=5);

x = TimeFrameExpand( a1, inHourly );

TimeFrameSet( inHourly );
a2 = EMA( C,15);
TimeFrameRestore();
Plot( TimeFrameExpand( a2, inHourly ), " H2", colorCustom12,style=5);

y  = TimeFrameExpand( a2, inHourly );

TimeFrameSet( inHourly );
a3 = EMA( C,100);
TimeFrameRestore();
Plot( TimeFrameExpand( a3, inHourly ), " Trend Line", colorBlue,style=5);

z = TimeFrameExpand( a3, inHourly );


TimeFrameSet( inDaily );
aa4 = MA( C,50);
TimeFrameRestore();
Plot( TimeFrameExpand( aa4, inDaily ), " D50 sma", colorOrange,style=style=8);


TimeFrameSet( inDaily );
aa2 = MA( C,100);
TimeFrameRestore();
Plot( TimeFrameExpand( aa2, inDaily ), " D100 sma", colorWhite,style=style=8);

z1 = TimeFrameExpand( aa2, inDaily );


TimeFrameSet( inDaily );
aa3 = MA( C,200);
TimeFrameRestore();
Plot( TimeFrameExpand( aa3, inDaily ), " D200 sma", colorGreen,style=style=8);


Buy = Cross ( x, y) ;
Sell = Cross (y,x);
Short=Sell;
Cover=Buy;
Buy = ExRem(Buy,Sell);
Sell = ExRem(Sell,Buy);
Short = ExRem(Short,Cover);
Cover = ExRem(Cover,Short);

BuyPrice=ValueWhen(Buy,C);
SellPrice=ValueWhen(Sell,C);
ShortPrice=ValueWhen(Short,C);
CoverPrice=ValueWhen(Cover,C);

Title = EncodeColor(colorWhite)+ "Chethan Umapathi" + " - " +  Name() + " - " + EncodeColor(colorRed)+ Interval(2) + EncodeColor(colorWhite) +

 "  - " + Date() +" - "+"\n" +EncodeColor(colorRed) +"Op-"+O+"  "+"Hi-"+H+"  "+"Lo-"+L+"  "+

"Cl-"+C+"  "+ "Vol= "+ WriteVal(V)+"\n"+

EncodeColor(colorLime)+

PlotShapes(IIf(Buy, shapeSquare, shapeNone),colorGreen, 0, L, Offset=-40);
PlotShapes(IIf(Buy, shapeSquare, shapeNone),colorLime, 0,L, Offset=-50);
PlotShapes(IIf(Buy, shapeUpArrow, shapeNone),colorWhite, 0,L, Offset=-45);
PlotShapes(IIf(Sell, shapeSquare, shapeNone),colorRed, 0, H, Offset=40);
PlotShapes(IIf(Sell, shapeSquare, shapeNone),colorOrange, 0,H, Offset=50);
PlotShapes(IIf(Sell, shapeDownArrow, shapeNone),colorWhite, 0,H, Offset=-45);
//PlotShapes( shape, IIf( Buy, colorGreen, colorRed ),0, IIf( Buy, Low, High ) );
dist = 2.5*ATR(5);
for( i = 0; i < BarCount; i++ ) {
if( Buy[i] ) PlotText( "Buy\n@" + Close[i], i, Low[i] - dist[i], colorWhite );
if( Sell[i] ) PlotText( "sell\n@" + Close[i], i, Low[i] + dist[i], colorWhite );
}
Trend2 =  x > y   ;
4 comments
Leave Comment
Please login here to leave a comment.
Veterans, Please let me know your thoughts
@chethanu ,
Excellent work done , Keep it up.
Did you back test on indices or stocks ?
let me know the results
Does this work? anyone tried it?