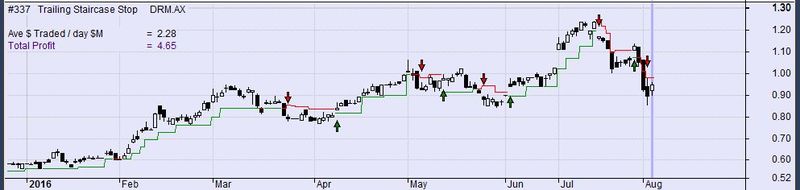
#337 Trailing Staircase Stop for Amibroker (AFL)
42gr almost 10 years ago Amibroker (AFL)
I use very simple one or two parameter trading systems to try and reduce data curve-fitting.
Here I’ve experimented with introducing some hysteresis in the Buy / Sell decision. Rather than making a decision on when to trade by comparing the trailing stop to the closing price, The Buy is decided by comparing the stop to the Low, and conversely for the Sell, the stop to the High.
Joe Ross, a 50+year veteran of trading also describes the use of these tactics to reduce whipsaw. RE “A Trader’s Musings: A Compilation Of Observations, Thoughts And Lessons From Over 50 Years Of Trading”, June 2016.
The Graph Title shows the share’s average money traded per day to get an indication of share liquidity. I like to also show the total profit of the system, normalized to 1 unit for the start of trading. This allows me to make direct comparisons to other trading systems I run.
The name of this AFL (#337) refers to the Amibroker auto generated script name.
Background
This work is built using the following:
http://www.wisestocktrader.com/indicators/1692-sve-trends-trail
AFL code by E.M.Pottasch, 12/28/2010,
idea from: http://stocata.org/metastock/stop_trail_trends.html
George
Screenshots
Indicator / Formula
/* #337  Trailing Staircase Stop


Uses H/L Hysteresis to reduce buy/sell whipsaw here:
Buy 	= iif( trends < L , 1,0);
Sell 	= IIf( trends > H , 1,0);

Code: GeorgeRai  3 Aug 2016


Background
http://www.wisestocktrader.com/indicators/1692-sve-trends-trail
AFL code by E.M.Pottasch, 12/28/2010,
idea from: http://stocata.org/metastock/stop_trail_trends.html

*/

// INIT =====
SetChartBkColor( colorlavender );
SetChartOptions(0, chartShowDates);
GraphXSpace = 5;


// PARAMS =====
atrfact 	= Param("Atr factor",1.5, 1.0, 10.0, 0.1);
period 		= Param("Period",17, 1, 100, 1);


// MAIN =====

function trends_func(resistance)
{
	trends 		= (H+L)/2; 	// initialize
	support 	= (H+L)/2; 	// initialize

	for( i = 4; i < BarCount; i++ )
	{
		// support
		prev = support[ i - 1 ];

		if (L[ i ] >= L[ i - 2 ]
			AND L[ i - 1 ] >= L[ i - 2 ]
			AND L[ i - 3 ] >= L[ i - 2 ]
			AND L[ i - 4 ] >= L[ i - 2 ])
		{
			support[ i ] = L[ i - 2 ];
		}
		else if (L[ i ] > H[ i - 1]*1.0013)
		{
			support[ i ] = H[ i - 1 ]*0.9945;
		}
		else if (L[ i ] > prev*1.1)
		{
			support[ i ] = prev*1.05;
		}
		else
		{
			support[ i ] = prev;
		}
		// trends
		prev = trends[ i - 1 ];

		if (H[ i ] > prev AND H[ i - 1 ] > prev)
		{
			trends[ i ] = Max(prev,support[ i ]);
		}
		else if (H[ i ] < prev AND H[ i - 1 ] < prev)
		{
			trends[ i ] = Min(prev,resistance[ i ]);
		}
		else if (H[ i ] > prev)
		{
			trends[ i ] = support[ i ];
		}
		else
		{
			trends[ i ] = resistance[ i ];
		}
	}
	return trends;
}


HiLo 		= IIf(H-L<1.5*MA(H-L,period),H-L,1.5*MA(H-L,period));
Href 		= IIf(L<=Ref(H,-1),H-Ref(C,-1),(H-Ref(C,-1))-(L-Ref(H,-1))/2);
Lref 		= IIf(H>=Ref(L,-1),Ref(C,-1)-L,(Ref(C,-1)-L)-(Ref(L,-1)-H)/2);
diff1 		= Max(HiLo,Href);
diff2 		= Max(diff1,Lref);
ATRmod 		= Wilders(diff2,period);
loss 		= atrfact*ATRmod;
resistance 	= C + loss;
trends 		= trends_func(resistance);		// calculate trends


// TRADE SIGNALS =====
Buy 	= iif( trends < L , 1,0);
Sell 	= IIf( trends > H , 1,0);

Buy 	= ExRem(Buy,Sell);
Sell 	= ExRem(Sell,Buy);


//  P/L Calcs =====
BuyPrice		= ValueWhen(Buy, Close);
SellPrice		= ValueWhen(Sell, Close);


// Calculate Profit for each sale
Profit 	= 0.0;
for (i=5; i<BarCount; i++) {
	if (Sell[i]) { Profit[i]  = (SellPrice[i]-BuyPrice[i])/ BuyPrice[i]; }
}  // for i

  // Plot(  100.0 * Profit, "Profit", colorViolet);   // Debug

TotalProfit = 0.0;
for (i=5; i<BarCount; i++) {
	// Add up Total Profit, filter out bad data
	if (!IsNull(Profit[i])  &&  (Profit[i] != 0.0)  && !IsNan(Profit[i]) )
	{
		TotalProfit = TotalProfit + Profit[i];
		// printf("I =  %g        Profit  =  %f  \n", i,  Profit[i]  );   // Debug
	}
}

printf("Total Profit  =  %f  \n", TotalProfit  );   // Debug


// GRAPHS =====

Plot(IIf(trends > C,trends,Null),"\ntrailShort",Colorred,styleStaircase);
Plot(IIf(trends < C,trends,Null),"\ntrailLong",Colorgreen, styleStaircase);
Plot(C, "", colorBlack, styleCandle);


PlotShapes( shapeUpArrow*Buy, colorGreen,		0, L, -20);
PlotShapes( shapeHollowUpArrow*Buy, colorBlack,0, L, -20) ;
PlotShapes( shapeDownArrow*Sell, colorRed,0,H, -20) ;
PlotShapes( shapeHollowDownArrow*Sell, colorBlack,0,H, -20) ;


Title =
"#337   Trailing Staircase Stop    " + " {{NAME}} "
+ "\n\nAve $ Traded / day $M                  =  " 	+   WriteVal((MA(C,20) * MA(V,20))/1E6, (format=0.2)) + "\n"
+ EncodeColor(colorIndigo)
+"Total Profit                                      =  " 	+   WriteVal(TotalProfit, (format=0.2)) 	+ "\n";
3 comments
Leave Comment
Please login here to leave a comment.
NOT WORKING IN NEW ANALYSIS WINDOW FOR BUY SELL SIGNAL PLEASE SOLVE THE AFL….
I checked the Analysis using Amibroker V 6.17
Scan works fine, I’m getting symbols with Buy Sell points
Back test works fine as well.
If you are referring to Exploration, you need to include an Explore Filter and at least one explore AddColumn() statement.
It’s more efficient that you add your own desired explore statement for what you want to do.
There are too many permutations to cover otherwise.
Very Well. Ty So much Amazing.