Intraday Volatility and VWap for Amibroker (AFL)
kartikmchandwani almost 10 years ago Amibroker (AFL)
This Formula is not Entirely created by me.
The second part that contains LR i;e LinearRegression is developed by me.
I have being using this Lr-Band of 200 Period on 5min time frame for
intraday trading and is successful for both Equity and Commodity of Indian market and do believe the same will work with any stock exchange
the only change the user has to do with the LR-Period. Rest is entirely remains the same. Yes thanks to the orignal author-UnKnown for the VolumeWeightedAveragePrice concept i in cluded it wiht my LR-200 period and the results were Amazing. Please BackTest and then use After Paper trade
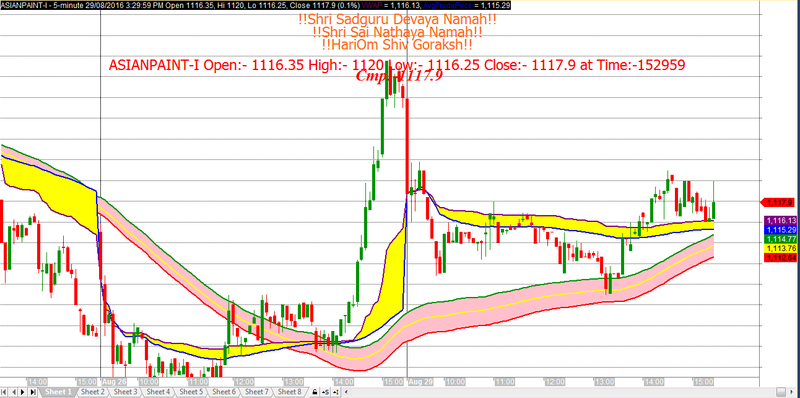
Screenshots
Indicator / Formula
_SECTION_BEGIN("VWAP");
Bars_so_far_today = 1 + BarsSince( Day() != Ref(Day(), -1));
StartBar = ValueWhen(TimeNum() == 090000, BarIndex());
TodayVolume = Sum(V,Bars_so_far_today);
IIf (BarIndex() >= StartBar, VWAP = Sum (C * V, Bars_so_far_today ) /
TodayVolume,0);
Plot (VWAP,"VWAP",colorViolet, styleThick);
_SECTION_END();

_SECTION_BEGIN("ATP");
DayChange = Day() != Ref(Day(), -1);
AvgTradePrice = Null;
CurDayBars = 0;
CurDayCloseSum = 0;
for (i = 0; i < BarCount; i++)
{
if (DayChange[i])
{
CurDayCloseSum = C[i];
CurDayBars = 1;
}
else
{
CurDayCloseSum = CurDayCloseSum + C[i];
CurDayBars++;
}
AvgTradePrice[i] = CurDayCloseSum / CurDayBars;
}
Plot(AvgTradePrice, "AvgTradePrice",colorBlue,styleThick);
ATP=AvgTradePrice;
_SECTION_END();
PlotOHLC(VWAP,AvgTradePrice,VWAP,AvgTradePrice,"",colorYellow,styleCloud|styleNoRescale|styleNoLabel);
Plot(LinearReg(H,200),"",colorGreen,styleLine|styleThick);
Plot(LinearReg(L,200),"",colorRed,styleLine|styleThick);
Plot(LinearReg(C,200),"",colorYellow,styleLine|styleThick);
PlotOHLC(LinearReg(L,200),LinearReg(H,200),LinearReg(L,200),LinearReg(H,200),"",colorPink,styleCloud|styleNoRescale|styleNoLabel);
5 comments
Leave Comment
Please login here to leave a comment.
Please BackTest and then Trade.
Any Improvements,Suggestions Welcome.
Thanks
Can you post the afl?
Many thanks
Can you please explain how to trade with this one sir?
what is it? How it’s work? When buy, wneh short? Where the takeprofit? where the stoplose?
Excellent work amazing this you change Mr Kartik. I apreciate If you have another good indicator please share. Thanks!