Support and resistance levels using SAR for Amibroker (AFL)
ABUSLIMAN06 almost 10 years ago Amibroker (AFL)
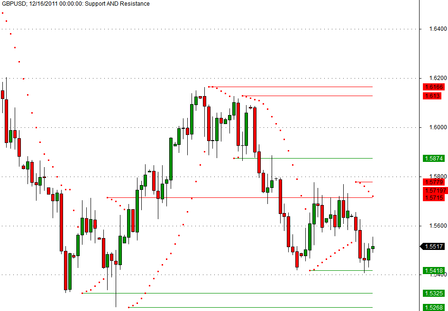
Support and resistance levels using SAR
Screenshots
Indicator / Formula
Copy & Paste Friendly
_SECTION_BEGIN("Support and resistance levels using SAR");


//Support and resistance levels using SAR.
//ABUSLIMAN
//Load into Indicator Builder
//Sensitivity of the levels can be changed with the variables
//Can test different numbers live with the Param function ctrl-R with open pane
acc = Param("Acceleration", 0.02, 0, 1, 0.001 );
accm = Param("Max. acceleration", 0.2, 0, 1, 0.001 );
NumLine     = Param("Num Lines",8,1,20,1);


Base = SAR( acc, accm );
GraphXSpace=0.5;
Plot(C,"",colorBlack,styleCandle);
Plot( SAR( acc, accm ), _DEFAULT_NAME(), ParamColor( "Color", colorCycle ), ParamStyle("Style", styleDots | styleNoLine, maskDefault | styleDots | styleNoLine ) );

for( i = 1; i <= numline; i++ )
{
ResBase = LastValue(ValueWhen(BASE>O AND Ref(BASE,-1)<O,BASE,i));
SupBase = LastValue(ValueWhen(BASE<O AND Ref(BASE,-1)>O,BASE,i));
Plot(ValueWhen( ResBase==BASE, BASE,1 ), "Resist Level", colorRed,styleLine);
Plot(ValueWhen( supbase==BASE, BASE,1 ), "Support Level", colorGreen,styleLine);
}
Title = Name() + "; " + Date() + ": Support AND Resistance";


_SECTION_END();
1 comments
Leave Comment
Please login here to leave a comment.
sir
how to trade and which time frame
which time frame for crudeoil and banknifty is best