Hybrid Support and Resistance for Amibroker (AFL)
neytiurlaber almost 10 years ago Amibroker (AFL)
This is a compilation of some afls i got from here and created a hybrid for personal use.
After all the afls I searched and tried, I came to a point that keeping it smart and simple makes my trading stress free.
Thank you to all contributors! All the recognition are yours!
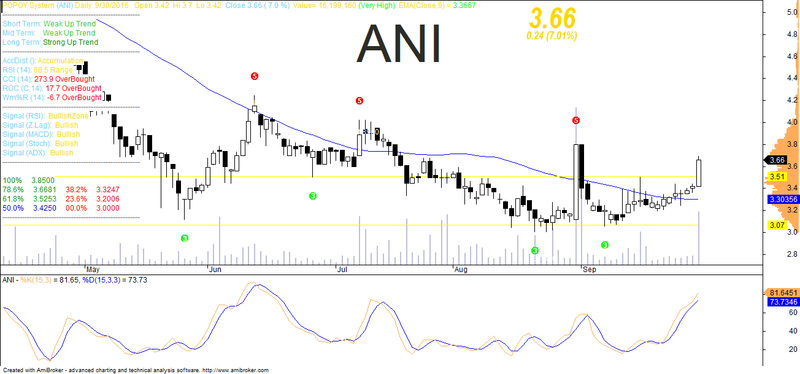
PS The green(5) and red(3) were just my substitution for up/down arrow :)
Screenshots
Indicator / Formula
Copy & Paste Friendly
//--------------------------------------------------------------//
//  Kenzie SR System - 09/2010
//  Modified By Kenzie Sebastian (kenziesr@yahoo.co.id)
//  Modified By vargaso_s@yahoo.com
//--------------------------------------------------------------

// Heikin Ashi - Calculated Properly with no use of AMA
_SECTION_BEGIN("HA Looping ( no AMA() )");

HaClose[0] = (Open[0]+High[0]+Low[0]+Close[0]) / 4;
HaOpen[0]  = (HaClose[0] + Open[0]) / 2;
HaHigh[0]  = Max( High[0], Max( HaClose[0], HaOpen[0] ) );
HaLow[0]   = Min( Low[0], Min( HaClose[0], HaOpen[0] ) );

for (i=1; i<BarCount; i++)
	{
	HaClose[i] = (Open[i]+High[i]+Low[i]+Close[i]) / 4;
	Haopen[i]  = (HaClose[i-1] + HaOpen[i-1]) / 2; // Here is the problem when using Arrays: Haopen always uses its own previous value
	HaHigh[i]  = Max( High[i], Max( HaClose[i], HaOpen[i] ) );
	Halow[i]   = Min( Low[i], Min( HaClose[i], HaOpen[i] ) );
}
//PlotOHLC( HaOpen, HaHigh, HaLow, HaClose, "HA", colorOrange, styleCandle );

_SECTION_END();
// Heikin Ashi - Calculated Properly with no use of AMA


TrailStop = HHV( C - 2 * ATR( 10 ), 15 );
ProfitTaker = EMA( H, 13 ) + 2 * ATR( 10 );

/* **********************************
Code to automatically identify pivots
********************************** */


// -- what will be our lookback range for the hh and ll?
farback = 140; //How Far back to go
nBars = 12; //Number of bars


// -- Create 0-initialized arrays the size of barcount
aHPivs = H - H;
aLPivs = L - L;


// -- More for future use, not necessary for basic plotting
aHPivHighs = H - H;
aLPivLows = L - L;
aHPivIdxs = H - H;
aLPivIdxs = L - L;
nHPivs = 0;
nLPivs = 0;
lastHPIdx = 0;
lastLPIdx = 0;
lastHPH = 0;
lastLPL = 0;
curPivBarIdx = 0;


// -- looking back from the current bar, how many bars
// back were the hhv and llv values of the previous
// n bars, etc.?
aHHVBars = HHVBars( H, nBars );
aLLVBars = LLVBars( L, nBars );
aHHV = HHV( H, nBars );
aLLV = LLV( L, nBars );


// -- Would like to set this up so pivots are calculated back from
// last visible bar to make it easy to "go back" and see the pivots
// this code would find. However, the first instance of
// _Trace output will show a value of 0
aVisBars = Status( "barvisible" );
nLastVisBar = LastValue( Highest( IIf( aVisBars, BarIndex(), 0 ) ) );
_TRACE( "Last visible bar: " + nLastVisBar );


// -- Initialize value of curTrend
curBar = ( BarCount - 1 );
curTrend = "";


if ( aLLVBars[curBar] < aHHVBars[curBar] )
{
    curTrend = "D";
}
else
{
    curTrend = "U";
}


// -- Loop through bars. Search for
// entirely array-based approach
// in future version
for ( i = 0; i < BarCount; i++ )
{
    curBar = ( BarCount - 1 ) - i;
// -- Have we identified a pivot? If trend is down...


    if ( aLLVBars[curBar] < aHHVBars[curBar] )
    {
// ... and had been up, this is a trend change
        if ( curTrend == "U" )
        {
            curTrend = "D";
// -- Capture pivot information
            curPivBarIdx = curBar - aLLVBars[curBar];
            aLPivs[curPivBarIdx] = 1;
            aLPivLows[nLPivs] = L[curPivBarIdx];
            aLPivIdxs[nLPivs] = curPivBarIdx;
            nLPivs++;
        }


// -- or current trend is up
    }
    else
    {
        if ( curTrend == "D" )
        {
            curTrend = "U";
            curPivBarIdx = curBar - aHHVBars[curBar];
            aHPivs[curPivBarIdx] = 1;
            aHPivHighs[nHPivs] = H[curPivBarIdx];
            aHPivIdxs[nHPivs] = curPivBarIdx;
            nHPivs++;
        }


// -- If curTrend is up...else...
    }


// -- loop through bars
}


// -- Basic attempt to add a pivot this logic may have missed
// -- OK, now I want to look at last two pivots. If the most
// recent low pivot is after the last high, I could
// still have a high pivot that I didn't catch
// -- Start at last bar
curBar = ( BarCount - 1 );


candIdx = 0;


candPrc = 0;


lastLPIdx = aLPivIdxs[0];


lastLPL = aLPivLows[0];


lastHPIdx = aHPivIdxs[0];


lastHPH = aHPivHighs[0];


if ( lastLPIdx > lastHPIdx )
{
// -- Bar and price info for candidate pivot
    candIdx = curBar - aHHVBars[curBar];
    candPrc = aHHV[curBar];


    if (
        lastHPH < candPrc AND
        candIdx > lastLPIdx AND
        candIdx < curBar )
    {
// -- OK, we'll add this as a pivot...
        aHPivs[candIdx] = 1;
// ...and then rearrange elements in the
// pivot information arrays


        for ( j = 0; j < nHPivs; j++ )
        {
            aHPivHighs[nHPivs-j] = aHPivHighs[nHPivs- ( j+1 )];
            aHPivIdxs[nHPivs-j] = aHPivIdxs[nHPivs-( j+1 )];
        }


        aHPivHighs[0] = candPrc ;


        aHPivIdxs[0] = candIdx;
        nHPivs++;
    }
}
else
{
// -- Bar and price info for candidate pivot
    candIdx = curBar - aLLVBars[curBar];
    candPrc = aLLV[curBar];


    if (
        lastLPL > candPrc AND
        candIdx > lastHPIdx AND
        candIdx < curBar )
    {
// -- OK, we'll add this as a pivot...
        aLPivs[candIdx] = 1;
// ...and then rearrange elements in the
// pivot information arrays


        for ( j = 0; j < nLPivs; j++ )
        {
            aLPivLows[nLPivs-j] = aLPivLows[nLPivs-( j+1 )];
            aLPivIdxs[nLPivs-j] = aLPivIdxs[nLPivs-( j+1 )];
        }


        aLPivLows[0] = candPrc;


        aLPivIdxs[0] = candIdx;
        nLPivs++;
    }
}

//============== EXPLORATION ==============
Buy = Cover = aLPivs == 1;
Sell = Short = aHPivs == 1;
SellPrice = ValueWhen( Sell, C, 1 );
BuyPrice = ValueWhen( Buy, C, 1 );
Long = Flip( Buy, Sell );
Shrt = Flip( Sell, Buy );

// volume spike ( check stocks whose volume for the day is at least 10% greater than its 30 day ave volume )
Volume_to = Sum(Volume, 31);
Volume_to = Volume_to - Volume;
Volume30 = Volume_to / 30;
percentage = ( abs( Volume30 - Volume ) ) / Volume30;
percentage = percentage * 100;
Filter = Volume > Volume30 AND percentage > 10;
// volume spike
Filter=Buy OR Sell;
Sell=ExRem(Sell,Buy); Buy=ExRem(Buy,Sell);
AddColumn(Buy,"Buy");
AddColumn(Sell,"Sell");
AddColumn(V*C, "Value");
AddColumn(BuyPrice,"BuyPrice", 1.4);
AddColumn(SellPrice,"SellPrice", 1.4);
AddColumn(O, "Opening");
AddColumn(H, "High");
AddColumn(L, "Low");
AddColumn(C, "Close");
AddColumn(Volume30,"Ave 30 days Volume", 1, colorBlue);
AddColumn(Volume,"Volume Today", 1, colorBlue);
AddColumn(Percentage," % Increase", 1.2, colorBlue);

//============== Plot price ==============
n = 15;


a =  C > ( MA( H, n ) + MA( L, n ) ) / 2;// then Buy next bar at market;


b = C < ( MA( H, n ) + MA( L, n ) ) / 2;// then Sell Short next bar at market;


state = IIf( BarsSince( a ) < BarsSince( b ), 1, 0 );


Longs = state == 1;


shorts = state == 0;


//Chart
Colorbar = IIf( Longs, colorGreen, IIf( Shorts, colorRed, colorGrey40 ) );
Plot( C, "Close", ParamColor("Color", colorDefault ), styleNoTitle | ParamStyle("Style") | GetPriceStyle() );

//Plot( C, "Close", colorbar, styleNoLine, styleNoTitle );
// ================= Rasheed's original code (with Lookback and Shift default set to his specs) =================

H0 = H;
L0 = L;
C0 = C;
O0 = O;

Lookback = Param("LookBack", 10, 10, 50, 1); // Default for interday commodity currency trading
shift = Param("Shift", 5, 1, 50, 1); // ?
x0 = LastValue(Cum(1));
x1 = x0 - shift;
H = Ref(H,  - shift + 1);
L = Ref(L,  - shift + 1);
H1 = LastValue(Ref(HHV(H, Lookback),  - 1));
L1 = LastValue(Ref(LLV(L, Lookback),  - 1));

Plot(H1, "H1", colorYellow);
Plot(L1, "L1", colorYellow);

H = H0;
L = L0;
C = C0;
O = O0;

up = Cross(H, H1)AND Cum(1) > x1;
dn = Cross(L1, L)AND Cum(1) > x1;
// ================= Rasheed's original code (with Lookback and Shift default set to his specs) =================

//============== Plot Shape (BUY/SELL SIGNAL) ==============
PlotShapes( IIf( aHPivs == 1, shapeDigit5, shapeNone ), colorRed, 0, High, Offset = 30 );
PlotShapes( IIf( aLPivs == 1, shapeDigit3 , shapeNone ), colorBrightGreen, 0, Low, Offset = -30 );
//PlotShapes( IIf(Buy, shapeSmallCircle, shapeNone),colorWhite, 0, BuyPrice, Offset = -30 );
//PlotShapes( IIf(Sell, shapeSmallCircle, shapeNone),colorWhite, 0 ,SellPrice,  Offset = 30  );
FirstVisibleBar = Status( "FirstVisibleBar" );
Lastvisiblebar = Status("LastVisibleBar");
for( b = Firstvisiblebar; b <= Lastvisiblebar AND b < BarCount; b++)
{
if( Buy[b] ) PlotText("\n\n\n\n\n "+NumToStr(BuyPrice[b],1.4),b,BuyPrice[b],colorWhite);
else if( Sell[b] ) PlotText(NumToStr(SellPrice[b], 1.4),b,SellPrice[b],colorWhite);
}

//============== EMA(13) ==============
//Plot( EMA( C, 5 ), "" , colorSkyblue + styleLine + styleNoRescale );


//============== TRENDING ==============
DTL = 30; // DTL = Define Trend Long


DTM = 7; // DTM = Define Trend Medium


DTS = 3;  // DTS = Define Trend Short


TL = LinRegSlope( MA( C, DTL ), 2 );  // TL = Trend Long


TM = LinRegSlope( MA( C, DTM ), 2 );  // TM = Trend Medium


TS = LinRegSlope( MA( C, DTS ), 2 );  // TS = Trend Short


TLL = IIf( LinRegSlope( MA( C, DTL ), 2 ) > 0, True, False );


TMM = IIf( LinRegSlope( MA( C, DTM ), 2 ) > 0, True, False );


TSS = IIf( LinRegSlope( MA( C, DTS ), 2 ) > 0, True, False );


//============== VOLUME ==============
Vlp = 30; //Volume lookback period


Vrg = MA( V, Vlp );


St = StDev( Vrg, Vlp );


Vp3 = Vrg + 3 * st;


Vp2 = Vrg + 2 * st;


Vp1 = Vrg + 1 * st;


Vn1 = Vrg - 1 * st;


Vn2 = Vrg - 2 * st;


//============== WILLIAM'S %R ==============
WR = ( ( HHV( H, 14 ) - C ) / ( HHV ( H, 14 ) - LLV ( L, 14 ) ) ) * -100;


//============== A/D ==============
TRH = IIf( Ref( C, -1 ) > H, Ref( C, -1 ), H );


TRL = IIf( Ref( C, -1 ) < L, Ref( C, -1 ), L );


ad = IIf( C > Ref( C, -1 ), C - TRL, IIf( C < Ref( C, -1 ), C - TRH, 0 ) );


WAD = Cum( ad );


wu = wad > Ref( wad, -1 );


wd = wad < Ref( wad, -1 );


//============== MACD ==============
MB = Cross ( MACD(), Signal() );


MS = Cross( Signal(), MACD() );


MB = ExRem( MB, MS );


MS = ExRem( MS, MB );


MB1 = MACD() > Signal();


MS1 = MACD() < Signal();


//============== STOCH ==============
StochKval = StochK( 10, 5 );


StochDval = StochD( 10, 5, 5 );


StochBuy = Cross( StochK( 10, 5 ), StochD( 10, 5, 5 ) );


StochSell = Cross ( StochD( 10, 5, 5 ), StochK( 10, 5 ) );


StBuy = StochK( 10, 5 ) > StochD( 10, 5, 5 );


StSell = StochK( 10, 5 ) < StochD( 10, 5, 5 );


//============== ADX ==============
adxBuy =  Cross( PDI( 14 ), MDI( 14 ) );


adxSell = Cross( MDI( 14 ), PDI( 14 ) );


adxBuy = ExRem( adxBuy, adxSell );


adxSell = ExRem( adxSell, adxBuy );


adxbuy1 = PDI( 14 ) > MDI( 14 );


adxsell1 = MDI( 14 ) > PDI( 14 );


//==============Zero Lag TMA ==============
function ZeroLagTEMA( array, period )
{
    TMA1 = TEMA( array, period );
    TMA2 = TEMA( TMA1, period );
    Diff = TMA1 - TMA2;
    return TMA1 + Diff ;
}


haClose = ( haClose + haOpen + haHigh + haLow ) / 4;


periodtm = 55;
ZLHa = ZeroLagTEMA( haClose, periodtm );
ZLTyp = ZeroLagTEMA( Avg, periodtm );
TMBuy = Cross( ZLTyp, ZLHa );
TMSell = Cross( ZLHa, ZLTyp );
TMBuy1 = ZLTyp > ZLHa ;
TMSell1 = ZLHa > ZLTyp ;


//============== ZLW ==============
R = ( ( HHV( H, 14 ) - C ) / ( HHV ( H, 14 ) - LLV ( L, 14 ) ) ) * -100;
MaxGraph = 10;
PeriodZ = 10;
EMA1 = EMA( R, PeriodZ );
EMA2 = EMA( EMA1, 5 );
Difference = EMA1 - EMA2;
ZeroLagEMA = EMA1 + Difference;
PR = 100 - abs( ZeroLagEMA );
MoveAvg = MA( PR, 5 );
ZBuy = Cross( PR, moveAvg ) AND PR < 30;
ZSell = Cross( moveAvg, PR ) AND PR > 70;
ZBuy1 = PR >= MoveAvg AND PR >= Ref( PR, -1 ) ;
ZSell1 = ( PR < MoveAvg ) OR PR >= MoveAvg AND PR < Ref( PR, -1 ) ;


//============== RS ==============
p = ( H + L + C ) / 3;
r1 = ( 2 * p ) - L;
s1 = ( 2 * p ) - H;
r2 = p + ( r1 - s1 );
s2 = p - ( r2 - s1 );
R3 = P + ( R2 - S2 );
S3 = P - ( R3 - S2 );


//============== IBUY ==============
Ibuy =  Cross( RSI( 14 ), EMA( RSI( 14 ), 9 ) );
Isell = Cross( EMA( RSI( 14 ), 9 ), RSI( 14 ) );
Ibuy = ExRem( Ibuy, ISell );
Isell = ExRem( ISell, Ibuy );
BlRSI = RSI( 14 ) > EMA( RSI( 14 ), 9 );
BrRSI = RSI( 14 ) < EMA( RSI( 14 ), 9 );


//=================Trend & Signals & Market Index ===============================
/// Please replace "00DSEGEN" with your market index ticker and activate the codes


/// Market Bull Bear


Cg = Foreign("^PSEi", "C");
Cgo= Ref(Cg,-1);


//Longterm Bullish or Bearish
Bullg = Cg > WMA(Cg,200);
Bearg= Cg <WMA(Cg,200);


//Midterm Bullish or Bearish
mBullg = Cg >WMA(Cg,50);
mBearg= Cg <WMA(Cg,50);


//Shortterm Bullish or Bearish
sBullg = Cg >WMA(Cg,15);
sBearg= Cg <WMA(Cg,15);
////////////////////////////////


xChange1=Cg - Ref(Cg,-1);
Change1 = StrFormat("%%1.2f% ",xChange1);
barche1= xChange1>=0;
Comche1= xChange1<0;
xperchange1 = xChange1/100;
perchange1 = StrFormat("%%1.2f% ",xperchange1);
positivechange1 = xperchange1>0;
negativechange1 = xperchange1<0;


//=================Trend & Signals & Market Index END===============================


// VOLUME -----------------------------------------------------------------------------------
_SECTION_BEGIN("Volume");
Color = ParamColor("Color", ColorRGB( 128, 128, 192 ) );
Plot( Volume, _DEFAULT_NAME(), ColorBlend( Color, GetChartBkColor(), 0.5  ), styleNoTitle | ParamStyle( "Style", styleHistogram | styleOwnScale | styleThick | styleNoLabel, maskHistogram  ), 2 );
_SECTION_END();
// VOLUME -----------------------------------------------------------------------------------

// STOCK NAME/MAGNIFIED MARKET PRICE -----------------------------------------------------------------------------------
_SECTION_BEGIN("Stock Name");
if (NOT ParamToggle("StockName Switch","On,Off"))
stockname=ParamColor("Stock name color",ColorRGB(44,44,37));
FS=Param("Font Size",36,11,100,1);
Hor=Param("Horizontal Position",750,1,1200,1);
Ver=Param("Vertical Position",1,1,830,1);
YC=TimeFrameGetPrice("C",inDaily,-1);
DD=Prec(C-YC,2);
xx=Prec((DD/YC)*100,2);

{
GfxSelectFont("Time news roman", Status("pxheight")/7 );
GfxSetTextAlign(6 );
GfxSetOverlayMode(1);
GfxSetTextColor(stockname);

GfxSetBkMode(0);
GfxTextOut(Name(),Status("pxwidth")/2, Status("pxheight")/18 );

GfxSelectFont("Arial Narrow", 36, 700, True );
GfxSetBkMode( colorWhite );
GfxSetTextColor( ParamColor("Color",colorGold) );
GfxTextOut(""+C, Hor+150 , Ver );
GfxSelectFont("Arial Narrow", 14, 700, True );
GfxSetBkMode( colorWhite );
GfxSetTextColor(ParamColor("Color",colorRed) );
GfxTextOut(""+DD+" ("+xx+"%)", Hor+150 , Ver+45);

}
_SECTION_END();
// STOCK NAME/MAGNIFIED MARKET PRICE -----------------------------------------------------------------------------------


_SECTION_BEGIN( "Special 6" );
// Parameters

//GraphXSpace=Param("GraphXSpace",5,-30,30,1);

//////////////////////////////////////////////////////////////////////////////////////////////////////////////////////////////////////////////

of = 1;
n = Param( "N Pivot Bars", 31, 2, 500, 1 );
Hh = HHV( H, n );
Ll = LLV( L, n );

p1 = ll + ( hh - ll ) * 0.5;
p2 = ll + ( hh - ll ) * 0.382;
p3 = ll + ( hh - ll ) * 0.618;
p4 = ll + ( hh - ll ) * 0.236;
p5 = ll + ( hh - ll ) * 0.786;


//Color1 =(ParamColor("(Highest Hi )",colorBrightGreen));
//Plot( Hh, "p1:", Color1, styleNoLine );

//Color2 =(ParamColor("ll + ( hh - ll ) * 0.786",colorYellow));
//Plot( p5, "p1:", Color2, styleNoLine );

//Color3 =(ParamColor("ll + ( hh - ll ) * 0.618",colorBlue));
//Plot( p3, "p1:", Color3, styleNoLine );

//Color4 =(ParamColor("ll + ( hh - ll ) * 0.5",colorBrightGreen));
//Plot( p1, "p1:", Color4, styleNoLine );

//Color5 =(ParamColor("ll + ( hh - ll ) * 0.382",colorRed));
//Plot( p2, "p1:", Color5, styleNoLine );

//Color6 =(ParamColor("ll + ( hh - ll ) * 0.236",colorLightBlue));
//Plot( p4, "p1:", Color6, styleNoLine );

//Color7 =(ParamColor("( ll )",colorBlack));
//Plot( Ll, "p1:", Color7, styleNoLine );

//Buy  = Cross(L, LLV( L, n ));
//Sell = Cross(HHV( H, n ), H);

//PlotShapes(IIf(Buy,  shapeSquare,  shapeNone),colorGreen,     0,L, Offset=- 5);
//PlotShapes(IIf(Buy,  shapeSquare,  shapeNone),colorLime,      0,L, Offset=-15);
//PlotShapes(IIf(Buy,  shapeUpArrow, shapeNone),colorWhite,     0,L, Offset=-10);

//PlotShapes(IIf(Sell, shapeSquare,  shapeNone),colorDarkRed,   0,H, Offset=  5);
//PlotShapes(IIf(Sell, shapeSquare,  shapeNone),colorRed,       0,H, Offset= 15);
//PlotShapes(IIf(Sell, shapeDownArrow,shapeNone),colorWhite,    0,H, Offset=-10);

//BuyPrice =ValueWhen(Buy,C);
//SellPrice=ValueWhen(Sell,C);

//Buy  = ExRem(Buy,Sell);
//Sell = ExRem(Sell,Buy);


//Buy1  = Cross(C, p4) ;
//Sell1 = Cross(p5, C) ;

//PlotShapes(shapeSmallUpTriangle*Buy1,ColorRGB( 80,125,165), 0,L,-20);
//PlotShapes(shapeSmallDownTriangle*Sell1,colorYellow, 0,H,-20);

//BuyPrice1 =ValueWhen(Buy1,  C,1);
//SellPrice1=ValueWhen(Sell1, C,1);

//Buy1  = ExRem(Buy1,Sell1);
//Sell1 = ExRem(Sell1,Buy1);


//Buy2  = Cross(C, p2) ;
//Sell2 = Cross(p3, C) ;

//PlotShapes(shapeSmallUpTriangle*Buy2,ColorRGB(230, 0, 0 ), 0,L,-20);
//PlotShapes(shapeSmallDownTriangle*Sell2,colorBlue, 0,H,-20);

//BuyPrice2 =ValueWhen(Buy2,  C,1);
//SellPrice2=ValueWhen(Sell2, C,1);

//Buy2  = ExRem(Buy2,Sell2);
//Sell2 = ExRem(Sell2,Buy2);


//Buy3  = Cross(C, p1) ;
//Sell3 = Cross(p1, C) ;

//PlotShapes(shapeSmallUpTriangle*Buy3,colorBrightGreen, 0,L,-30);
//PlotShapes(shapeSmallDownTriangle*Sell2,colorBrightGreen, 0,H,-20);

//BuyPrice3 =ValueWhen(Buy3,  C,1);
//SellPrice3=ValueWhen(Sell3, C,1);

//Buy3  = ExRem(Buy3,Sell3);
//Sell3 = ExRem(Sell3,Buy3);


/*if(SelectedValue(Buy OR Buy1 OR Buy2 OR Buy3))
{
	StaticVarSet( "tmp", 1 );
	PlaySound("C:\\Program Files\\AmiBroker\\sound\\buy.wav");
	Say("BILI BILI BILI");
//	SetChartBkColor(ColorRGB(143,188,143));
}
if(SelectedValue(Sell OR Sell1 OR Sell2 OR Sell3))
{
	StaticVarSet( "tmp", 0 );
	PlaySound("C:\\Program Files\\AmiBroker\\sound\\sell.wav");
	Say("BENTA BENTA BENTA");
//	SetChartBkColor(ColorRGB(240,128,128));
}
if(StaticVarGet("tmp")==1)
{
//	SetChartBkColor(ColorRGB(143,188,143));
}
else
{
//	SetChartBkColor(ColorRGB(240,128,128));
}*/


_SECTION_END();


//////////////////////////////////////////////////////////////////////////////////////////////////////////////////////////////////////////////
//==================================================================================================================================================================================
//                                                                                   ICHIMOKU
_SECTION_BEGIN("Ichimoku");
turn = Param( "Tenkan-Sen Line", 9, 1, 100 );
prds = Param( "Kijun-Sen Line", 26, 1, 26, 1 );
span = Param( "Spans Period", 52, 1, 52, 1 );
//SetChartOptions(0,chartShowArrows|chartShowDates);

SL = ( HHV( H, turn ) + LLV( L, turn ) ) / 2;
TL = ( HHV( H, prds ) + LLV( L, prds ) ) / 2;
DL = C;
Sp1 = ( SL + TL ) / 2;
Sp2 = ( HHV( H, span ) + LLV( L, span ) ) / 2;

//_N( Title = StrFormat( "{{NAME}} - {{INTERVAL}} {{DATE}} Open %g, Hi %g, Lo %g, Close %g (%.1f%%) Vol " + WriteVal( V, 1.0 ) + " {{VALUES}}", O, H, L, C, SelectedValue( ROC( C, 1 ) ) ) );

//Plot( C, "Close", colorBlack, styleNoTitle | GetPriceStyle() );
//Plot( SL, "SL", colorRed, styleThick | styleNoLabel );
//Plot( TL, "TL", colorBlue, styleThick | styleNoLabel );
//Plot( DL, "CS", colorYellow, styleThick | styleNoLabel, Null, Null, -prds, -2 );

color = IIf( Sp1 > Sp2, ParamColor( "Span A Color", colorLightBlue ), ParamColor( "Span B Color", colorLightBlue ) );
//PlotOHLC ( Sp1, Sp1, Sp2, Sp2, "Cloud", Color, styleCloud | styleNoLabel, Null, Null, prds, -2 );
MyPort = 50000;
MyATR=ATR(7);//Enter ATR Average or use the 14 Day Moving Average of ATR
PL = Ref(C,-26);

//Title = Name() + " (" + StrLeft(FullName(), 10) +
//") ATR: " + NumToStr(ATR(1), 4.2) + " ( " +
//NumToStr((C - Ref(C, -1)), 4.2) + " / " +
//NumToStr((((C - Ref(C, -1)) / Ref(C, -1)) * 100), 2.1) + "% ) " +
//WriteVal( SelectedValue( DateTime() ), formatDateTime) +
//"\nTL: " + WriteVal(SL, 2.2) +
//"\nKL: " + WriteVal(TL, 2.2) +
//"\nSpan A: " + WriteVal(Sp1, 2.2) +
//"\nSpan B: " + WriteVal(Sp2, 2.2) +
//"\nSpan Diff: " + WriteVal(Sp1 - Sp2, 2.2) +
//"\nChikou Span Today: " + WriteVal(C, 2.2) +
//"\nChikou Span 26 Days Ago: " + WriteVal(PL, 2.2) +
//"\nPrice Limit: " + WriteVal((TL+ATR(14)*1.5), 2.2) +
//"\nIchimoku SL Pt :" + WriteVal (MyATR*3,format=1.2 )+
//"\nSL Value: " + WriteVal ( Close - (MyATR*3),(format=1.2)) +
//"\nRisk: " + WriteVal ( (MyATR*3/Close)*100,format=1.2 ) + "%" +
//"\nShare Limit: " + WriteVal ((MyPort*0.01)/(MyATR*3),(format=1.2))+
//"\n"+ "P"+WriteVal(C*((MyPort*0.02)/(MyATR*3)),(format=1.0))+ " of" +" "+ WriteVal ((MyPort)/1000,format=1.0)+"T";
_SECTION_END();
_SECTION_END();
//
//==================================================================================================================================================================================


//============== TITLE ==============
_SECTION_BEGIN( "Title" );
SetChartOptions(0,chartShowArrows|chartShowDates);
printf( "Open : " + O );


if ( Status( "action" ) == actionIndicator )
    (
        Title = EncodeColor( colorGold ) + "POPOY System" + EncodeColor( ColorRGB( 111, 208, 255 ) )  + " (" +  Name() + ") " + EncodeColor( colorGold ) + Interval( 2 ) +
                "  " + Date() + " " + "  Open " + O + "  " + "Hi " +  H + "  " + "Lo " + L + "  " + EncodeColor( ColorRGB( 111, 208, 255 ) ) +
                "Close " + C + " ( " + WriteVal( ( C - Ref( C, -1 ) ) * 100 / Ref( C, -1 ), 1.1 ) + " %)" + EncodeColor( colorGold ) + "  Value= " + WriteVal( V*C, 1.0 )
                + " " + WriteIf( V*C > Vp2, EncodeColor( colorBrightGreen ) + "(Very High)", WriteIf( V*C > Vp1, EncodeColor( colorLime ) + "(High)", WriteIf( V*C > Vrg, EncodeColor( colorLime ) + "(Above Average)",
                                 WriteIf( V*C <Vrg AND V*C >Vn1, EncodeColor( ColorRGB( 255, 0, 128 ) ) + "(Less than Average)", WriteIf( V*C < Vn1, "(Low)", "" ) ) ) ) ) + EncodeColor( colorGold ) + "  "
                + EncodeColor( colorGold ) + "EMA(Close,9) = " +EncodeColor( colorBrightGreen ) + WriteVal( MA( C, 9 ), 1.4 )


                + "\n" +  EncodeColor( colorGrey40 ) + "--------------------------------------------------------"


                + "\n" + EncodeColor( ColorRGB( 111, 208, 255 ) ) + "Short Term: " +
                WriteIf( TS > 0 AND TS < 0.3, EncodeColor( colorLime ) + "Weak Up Trend",
                         WriteIf( TS >= 0.3 AND TS < 0.6 , EncodeColor( colorGold ) + "Medium Up Trend",
                                  WriteIf( TS >= 0.6, EncodeColor( colorGreen ) + "Strong Up Trend",
                                           WriteIf( TS<0 AND TS> -0.3, EncodeColor( colorPink ) + "Weak Down Trend",
                                                    WriteIf( TS <= -0.3 AND TS > -0.6 , EncodeColor( ColorRGB( 255, 0, 128 ) ) + "Medium Down Trend",
                                                             WriteIf( TS <= -0.6, EncodeColor( colorRed ) + "Strong Down Trend", EncodeColor( colorGold ) + "Sideways" ) ) ) ) ) )


                + "\n" + EncodeColor( ColorRGB( 111, 208, 255 ) ) + "Mid Term:    " +
                WriteIf( TM > 0 AND TM < 0.3, EncodeColor( colorLime ) + "Weak Up Trend",
                         WriteIf( TM >= 0.3 AND TM < 0.6 , EncodeColor( colorGold ) + "Medium Up Trend",
                                  WriteIf( TM >= 0.6, EncodeColor( colorGreen ) + "Strong Up Trend",
                                           WriteIf( TM<0 AND TM> -0.3, EncodeColor( colorPink ) + "Weak Down Trend",
                                                    WriteIf( TM <= -0.3 AND TM > -0.6 , EncodeColor( ColorRGB( 255, 0, 128 ) ) + "Medium Down Trend",
                                                             WriteIf( TM <= -0.6, EncodeColor( colorRed ) + "Strong Down Trend", EncodeColor( colorGold ) + "Sideways" ) ) ) ) ) )


                + "\n" + EncodeColor( ColorRGB( 111, 208, 255 ) ) + "Long Term: " +
                WriteIf( TL > 0 AND TL < 0.3, EncodeColor( colorLime ) + "Weak Up Trend",
                         WriteIf( TL >= 0.3 AND TL < 0.6 , EncodeColor( colorGold ) + "Medium Up Trend",
                                  WriteIf( TL >= 0.6, EncodeColor( colorGreen ) + "Strong Up Trend",
                                           WriteIf( TL<0 AND TL> -0.3, EncodeColor( colorPink ) + "Weak Down Trend",
                                                    WriteIf( TL <= -0.3 AND TL > -0.6 , EncodeColor( ColorRGB( 255, 0, 128 ) ) + "Medium Down Trend",
                                                             WriteIf( TL <= -0.6, EncodeColor( colorRed ) + "Strong Down Trend", EncodeColor( colorGold ) + "Sideways" ) ) ) ) ) )


                + "\n" +  EncodeColor( colorGrey40 ) + "--------------------------------------------------------"


                + "\n" + EncodeColor( ColorRGB( 111, 208, 255 ) ) + "AccDist (): " + WriteIf( wu, EncodeColor( colorGold ) + "Accumulation", WriteIf( wd, EncodeColor( colorRed ) + "Distribution", "Neutral" ) )


                + "\n" + EncodeColor( ColorRGB( 111, 208, 255 ) ) + "RSI (14): " + WriteIf( RSI( 14 ) > 30 AND RSI( 14 ) < 70, EncodeColor( colorGold ), WriteIf( RSI( 14 ) < 30 , EncodeColor( colorBlue ), EncodeColor( colorRed ) ) ) + WriteVal( RSI( 14 ), format = 1.1 )
                + WriteIf( RSI( 14 ) > 30 AND RSI( 14 ) < 70, " Range" + EncodeColor( colorGold ), WriteIf( RSI( 14 ) < 30 , " OverSold" + EncodeColor( colorBlue ), " OverBought" + EncodeColor( colorRed ) ) )


                + "\n" + EncodeColor( ColorRGB( 111, 208, 255 ) ) + "CCI (14): " + WriteIf( CCI( 14 ) > -100 AND CCI( 14 ) < 100, EncodeColor( colorGold ), WriteIf( CCI( 14 ) < -100 , EncodeColor( colorBlue ), EncodeColor( colorRed ) ) ) + WriteVal( CCI( 14 ), format = 1.1 )
                + WriteIf( CCI( 14 ) > -100 AND CCI( 14 ) < 100, " Range" + EncodeColor( colorGold ), WriteIf( CCI( 14 ) < -100 , " OverSold" + EncodeColor( colorBlue ), " OverBought" + EncodeColor( colorRed ) ) )


                + "\n" + EncodeColor( ColorRGB( 111, 208, 255 ) ) + "ROC (C,14): " + WriteIf( ROC( C, 14 ) > -10 AND ROC( C, 14 ) < 10, EncodeColor( colorGold ), WriteIf( ROC( C, 14 ) < -10 , EncodeColor( colorBlue ), EncodeColor( colorRed ) ) ) + WriteVal( ROC( C, 14 ), format = 1.1 )
                + WriteIf( ROC( C, 14 ) > -10 AND ROC( C, 14 ) < 10, " Range" + EncodeColor( colorGold ), WriteIf( ROC( C, 14 ) < -10 , " OverSold" + EncodeColor( colorBlue ), " OverBought" + EncodeColor( colorRed ) ) )


                + "\n" + EncodeColor( ColorRGB( 111, 208, 255 ) ) + "Wm%R (14): " + WriteIf( WR > -80 AND WR < -20, EncodeColor( colorGold ), WriteIf( WR < -80 , EncodeColor( colorBlue ), EncodeColor( colorRed ) ) ) + WriteVal( WR, format = 1.1 )
                + WriteIf( WR > -80 AND WR < -20, " Range" + EncodeColor(colorGold ), WriteIf( WR < -80 , " OverSold" + EncodeColor( colorBlue ), " OverBought" + EncodeColor( colorRed ) ) )


                + "\n" +  EncodeColor( colorGrey40 ) + "--------------------------------------------------------"


                + "\n" + EncodeColor( ColorRGB( 111, 208, 255 ) ) + "Signal (RSI):  " + WriteIf( Ibuy, EncodeColor( colorGold) + "BuyWarning", WriteIf( Isell, EncodeColor( colorRed ) + "SellWarning", WriteIf( BlRSI, EncodeColor( colorGold ) + "BullishZone", WriteIf( BrRSI, EncodeColor( colorRed ) + "BearishZone", "Neutral" ) ) ) )


                + "\n" + EncodeColor( ColorRGB( 111, 208, 255 ) ) + "Signal (Z Lag):  " + WriteIf( TMBuy, EncodeColor(colorGold ) + "Buy", WriteIf( TMSell, EncodeColor( colorRed ) + "Sell", WriteIf( TMBuy1, EncodeColor( colorGold ) + "Bullish", WriteIf( TMSell1, EncodeColor( colorRed ) + "Bearish", "Neutral" ) ) ) )


                + "\n" + EncodeColor( ColorRGB( 111, 208, 255 ) ) + "Signal (MACD):  " + WriteIf( MB, EncodeColor( colorGold ) + "Buy", WriteIf( MS, EncodeColor( colorRed ) + "Sell", WriteIf( MB1, EncodeColor( colorGold ) + "Bullish", WriteIf( MS1, EncodeColor( colorRed ) + "Bearish", "Neutral" ) ) ) )


                + "\n" + EncodeColor( ColorRGB( 111, 208, 255 ) ) + "Signal (Stoch):  " + WriteIf( StochBuy, EncodeColor( colorGold ) + "Buy", WriteIf( StochSell, EncodeColor( colorRed ) + "Sell", WriteIf( StBuy, EncodeColor( colorGold ) + "Bullish", WriteIf( StSell, EncodeColor( colorRed ) + "Bearish", "Neutral" ) ) ) )


                + "\n" + EncodeColor( ColorRGB( 111, 208, 255 ) ) + "Signal (ADX):  " + WriteIf( adxBuy, EncodeColor( colorGold ) + "Buy", WriteIf( adxSell, EncodeColor( colorRed ) + "Sell", WriteIf( adxBuy1, EncodeColor( colorGold ) + "Bullish", WriteIf( adxSell1, EncodeColor( colorRed ) + "Bearish", "Neutral" ) ) ) )


                + "\n" +  EncodeColor( colorGrey40 ) + "--------------------------------------------------------"


+"\n"+  EncodeColor( colorWhite )+"Fibo Retracement"
+"\n"+  EncodeColor( colorGreen )+"100%     "+  EncodeColor( colorGreen )+WriteVal(Hh,1.4)
+"\n"+  EncodeColor( colorGreen )+"78.6%     "+EncodeColor(colorGreen)+WriteVal(p5,1.4)+EncodeColor(colorRed)+"     38.2%     "+EncodeColor(colorRed)+WriteVal(p2,1.4)
+"\n"+  EncodeColor( colorGreen )+"61.8%     "+EncodeColor(colorGreen)+WriteVal(p3,1.4)+EncodeColor(colorRed)+"     23.6%     "+EncodeColor(colorRed)+WriteVal(p4,1.4)
+"\n"+  EncodeColor( colorBlue )+"50.0%     "+EncodeColor(colorBlue)+WriteVal(p1,1.4)+  EncodeColor( colorRed )+"     00.0%     "+WriteVal(Ll,1.4)

//                + "\n" +  EncodeColor( colorBlack ) + "----------------------------------------------------------------------------"
//                + "\n" + EncodeColor( ColorRGB( 111, 208, 255 ) ) + "Trigger Stop : " + EncodeColor( colorLime ) + WriteVal( TrailStop, format = 1.4 )
//                + "\n" + EncodeColor( ColorRGB( 111, 208, 255 ) ) + "Trigger Price Profit : " + EncodeColor( colorLime ) + WriteVal( Profittaker, format = 1.4 )
                + "\n" +  EncodeColor( colorGrey40 ) + "--------------------------------------------------------"
//+  EncodeColor( colorWhite )+"\nTL: " + WriteVal(SL, 2.2)
//+  EncodeColor( colorWhite )+"\nKL: " + WriteVal(TL, 2.2)
//+  EncodeColor( colorWhite )+"\nSpan A: " + WriteVal(Sp1, 2.2)
//+  EncodeColor( colorWhite )+"\nSpan B: " + WriteVal(Sp2, 2.2)
//+  EncodeColor( colorWhite )+"\nSpan Diff: " + WriteVal(Sp1 - Sp2, 2.2)
//+  EncodeColor( colorWhite )+"\nChikou Span Today: " + WriteVal(C, 2.2)
//+  EncodeColor( colorWhite )+"\nChikou Span 26 Days Ago: " + WriteVal(PL, 2.2)
//+  EncodeColor( colorWhite )+"\nPrice Limit: " + WriteVal((TL+ATR(14)*1.5), 2.2)
//+  EncodeColor( colorWhite )+"\nIchimoku SL Pt :" + WriteVal (MyATR*3,format=1.2 )
//+  EncodeColor( colorWhite )+"\nSL Value: " + WriteVal ( Close - (MyATR*3),(format=1.2))
//+  EncodeColor( colorWhite )+"\nRisk: " + WriteVal ( (MyATR*3/Close)*100,format=1.2 ) + "%"
//+  EncodeColor( colorWhite )+"\nShare Limit: " + WriteVal ((MyPort*0.01)/(MyATR*3),(format=1.2))
//+  EncodeColor( colorWhite )+"\n"+ "P"+WriteVal(C*((MyPort*0.02)/(MyATR*3)),(format=1.0))+ " of" +" "+ WriteVal ((MyPort)/1000,format=1.0)+"T"
//                + "\n" +EncodeColor( ColorRGB( 111, 208, 255 ) ) + "R1: " + EncodeColor( colorOrange ) + WriteVal( r1, format = 1.4 )
//                + EncodeColor( ColorRGB( 111, 208, 255 ) ) + " R2: " + EncodeColor( colorOrange ) + WriteVal( r2, format = 1.4 )
//                + EncodeColor( ColorRGB( 111, 208, 255 ) ) + " R3: " + EncodeColor( colorOrange ) + WriteVal( r3, format = 1.4 )
//                + "\n" +EncodeColor( ColorRGB( 111, 208, 255 ) ) + "S1: " + EncodeColor( colorOrange ) + WriteVal( s1, format = 1.4 )
//                + EncodeColor( ColorRGB( 111, 208, 255 ) ) + " S2: " + EncodeColor( colorOrange ) + WriteVal( s2, format = 1.4 )
//                +EncodeColor( ColorRGB( 111, 208, 255 ) ) + " S3: " + EncodeColor( colorOrange ) + WriteVal( s3, format = 1.4 )
                 );
_SECTION_END();
//==================================================================================================================================================================================

//==================================================================================================================================================================================
//                                                                                           VOLUME AT PRICE
_SECTION_BEGIN("Volume At Price");
PlotVAPOverlay( Param("Lines", 300, 100, 1000, 1 ), Param("Width", 5, 1, 100, 1 ), ParamColor("Color", colorCycle ), ParamToggle("Side", "Left|Right" ) | 4*ParamToggle("Z-order", "On top|Behind", 1 ) );
_SECTION_END();
//==================================================================================================================================================================================

//==================================================================================================================================================================================
//                                                                                           TREND LINES
//percent  = 0.01 * 1; /* Adjust this percent as necessary, I use .01 because FOREX is a 0.0000 number */
//firstpointL = 2;
//firstpointH = 2;
//
//y0=LastValue(Trough(L,percent,firstpointL));
//y1=LastValue(Trough(Ref(L,-1),percent,1));
//
//for( t = 1; t < BarCount AND y0 >= y1; t++ )
//{
//       firstpointL++;
//        y0=LastValue(Trough(L,percent,firstpointL));
//}
//
//x0=BarCount - 1 - LastValue(TroughBars(L,percent,firstpointL));
//x1=BarCount - 1 - LastValue(TroughBars(Ref(L,-1),percent,1));
//LineL = LineArray( x0, y0, x1, y1, 1 );
//
//Plot( LineL, " Support Trend line", colorWhite, 1 + 4 );
//
//yt0=LastValue(Peak(H,percent,firstpointH));
//yt1=LastValue(Peak(Ref(H,-1),percent,1));
//
//for(t = 1; t < BarCount AND yt0 <= yt1; t++ )
//{
//        firstpointH++;
//        yt0=LastValue(Peak(H,percent,firstpointH));
//}
//xt0=BarCount - 1 - LastValue(PeakBars(H,percent,firstpointH));
//xt1=BarCount - 1 - LastValue(PeakBars(Ref(H,-1),percent,1));
//LineH = LineArray( xt0, yt0, xt1, yt1, 1 );
//
//Plot( LineH, "Resistance Trend line", colorWhite,1 + 4 );
//
//==================================================================================================================================================================================

_SECTION_BEGIN("MA3");
P = ParamField("Price field",-1);
Periods = Param("Periods", 15, 2, 300, 1, 10 );
Plot( MA( P, Periods ), _DEFAULT_NAME(), ParamColor( "Color", colorCycle ), ParamStyle("Style") );
_SECTION_END();
6 comments
Leave Comment
Please login here to leave a comment.
SIR
LOOK GOOD
WHICH TIME FRAME FOR CRUDE IS BEST
HOW TO TRADE
I APPLIES TO OTHER STOCKS
IF YES TIME FRAME
THANKS
Hi Sir,
Thanks for posting good AFL.
Performance is good when i back-tested it.
Does this AFL repaints signals?
Is there a way to reduce number of signals, as of now i feel too many signals are getting generated.
Thanks
error please..
line :559 and 563
error 61
amibroker 6.20.1
please ..
thanks
I have fixed the bug.
This AFL looks into the future, a total time waste
this indicator producing signals after 5 or more candles