Heikin Ashi Trading System for Amibroker (AFL)
snehil2010 almost 10 years ago Amibroker (AFL)
Heikin-Ashi is a trend visualization technique based on Japanese candlestick charting. In-fact, Heikin-Ashi is also a type of candlestick, whose OHLC value differs from the traditional candlesticks. In Japanese, Heikin means “average” and “ashi” means “pace” .Taken together, Heikin-Ashi represents the average-pace of prices. Heikin-Ashi Candlesticks use the open-close data from the prior period and the open-high-low-close data from the current period to create a combo candlestick.
You can read more about this trading system and download the detailed backtest report here.
Screenshots
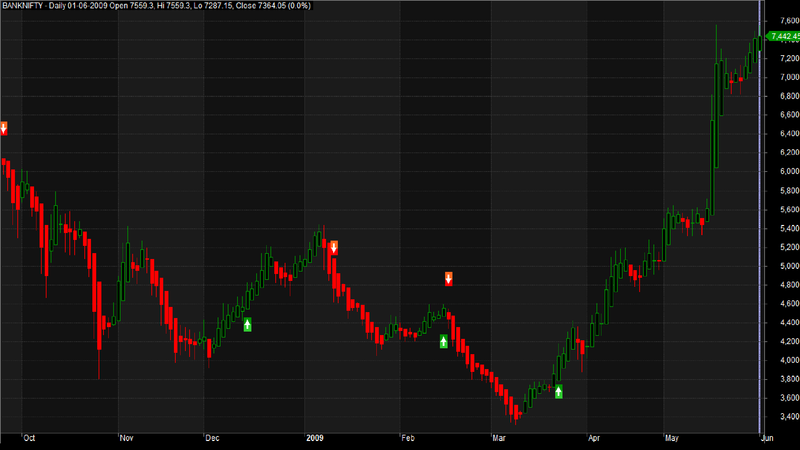
Indicator / Formula
Copy & Paste Friendly
//------------------------------------------------------
//
//  Formula Name:    Heikin Ashi Trading System
//  Author/Uploader: Trading Tuitions
//  E-mail:          support@tradingtuitions.com
//  Website:         www.tradingtuitions.com
//------------------------------------------------------


_SECTION_BEGIN("Heikin Ashi Trading System");

SetOption( "InitialEquity", 200000);
SetTradeDelays( 1, 1, 1, 1 );
SetOption("FuturesMode" ,True);
SetOption("MinShares",1);
SetOption("CommissionMode",2);
SetOption("CommissionAmount",50);
SetOption("AccountMargin",10);
SetOption("RefreshWhenCompleted",True);
SetPositionSize(120,spsShares);
SetOption( "AllowPositionShrinking", True );

BuyPrice=Open;
SellPrice=Open;
ShortPrice=Open;
CoverPrice=Open;

SetChartOptions(0,chartShowArrows|chartShowDates);
_N(Title = StrFormat("{{NAME}} - {{INTERVAL}} {{DATE}} Open %g, Hi %g, Lo %g, Close %g (%.1f%%) {{VALUES}}", O, H, L, C ));

HaClose = (O + H + L + C)/4;
HaOpen = AMA( Ref( HaClose, -1 ), 0.5 );
HaHigh = Max( H, Max( HaClose, HaOpen ) );
HaLow = Min( L, Min( HaClose, HaOpen ) );

barcolor = IIf(HaClose >= HaOpen,colorGreen,colorRed);

PlotOHLC( HaOpen, HaHigh, HaLow, HaClose, "", barcolor, styleCandle );

printf("\nHaOpen : " + HaOpen );
printf("\nHaHigh : " + HaHigh );
printf("\nHaLow : " + HaLow );
printf("\nHaClose : " + HaClose );

Candles=param("Candles",1,1,5,1);
periods=param("periods",40,10,200,10);

Buy = Sum(HaClose >= HaOpen,Candles)==Candles AND HaOpen==HaLow AND C>EMA(C,periods);
Short= Sum(HaClose <= HaOpen,Candles)==Candles AND HaOpen=HaHigh AND C<EMA(C,periods);
Sell=Short OR C<EMA(C,periods);
Cover=Buy OR C>EMA(C,periods);

Buy = ExRem(Buy,Sell);
Sell = ExRem(Sell,Buy);
Short=ExRem(Short,Cover);
Cover=ExRem(Cover,Short);

printf("\nBuy : " + Buy );
printf("\nSell : " + Sell );
printf("\nShort : " + Short );
printf("\nCover : " + Cover );

Stoploss=param("SL",1,1,5,1);

ApplyStop(Type=0,Mode=1,Amount=StopLoss);


/* Plot Buy and Sell Signal Arrows */
PlotShapes(IIf(Buy, shapeSquare, shapeNone),colorGreen, 0, L, Offset=-40);
PlotShapes(IIf(Buy, shapeSquare, shapeNone),colorLime, 0,L, Offset=-50);
PlotShapes(IIf(Buy, shapeUpArrow, shapeNone),colorWhite, 0,L, Offset=-45);
PlotShapes(IIf(Cover, shapeSquare, shapeNone),colorGreen, 0, L, Offset=-40);
PlotShapes(IIf(Cover, shapeSquare, shapeNone),colorLime, 0,L, Offset=-50);
PlotShapes(IIf(Cover, shapeUpArrow, shapeNone),colorWhite, 0,L, Offset=-45);
PlotShapes(IIf(Sell, shapeSquare, shapeNone),colorRed, 0, H, Offset=40);
PlotShapes(IIf(Sell, shapeSquare, shapeNone),colorOrange, 0,H, Offset=50);
PlotShapes(IIf(Sell, shapeDownArrow, shapeNone),colorWhite, 0,H, Offset=-45);
PlotShapes(IIf(Short, shapeSquare, shapeNone),colorRed, 0, H, Offset=40);
PlotShapes(IIf(Short, shapeSquare, shapeNone),colorOrange, 0,H, Offset=50);
PlotShapes(IIf(Short, shapeDownArrow, shapeNone),colorWhite, 0,H, Offset=-45);


_SECTION_END();
0 comments
Leave Comment
Please login here to leave a comment.