Stochastic candles for Amibroker (AFL)
wwfwwf over 9 years ago Amibroker (AFL)
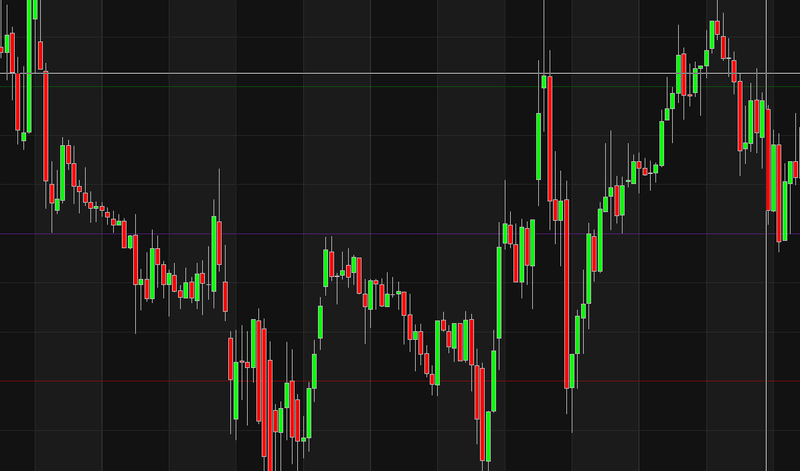
This indicator is a normalized price representation made with candlesticks. The dynamic scale between 0 and 100% is calculated upon the last X periods (50 periods in the code, you can change it at will). It can be used to detect price exhaustion in a trend of continuation if the candlesticks remains above the 50% level.
Screenshots
Indicator / Formula
Copy & Paste Friendly
Period  = Param("Period",50,1,200,1);
//lastest highhest high and lowest low over "period"
hh = HHV(H,Period);
ll = LLV(L,Period);
scale = hh-ll;

dynO = ((open-ll)/scale)*100;
dynH = ((high-ll)/scale)*100;
dynL = ((low-ll)/scale)*100;
dynC = ((close-ll)/scale)*100;

PlotOHLC(dynO,dynH,dynL,dynC,"",colorDefault,styleCandle);
PlotGrid(50,ColorRGB(160,32,240));
PlotGrid(20,Colorred);
PlotGrid(80,Colorgreen);
1 comments
Leave Comment
Please login here to leave a comment.
Interesting, thank you.