Ertanaliz for Amibroker (AFL)
manicminer over 9 years ago Amibroker (AFL)
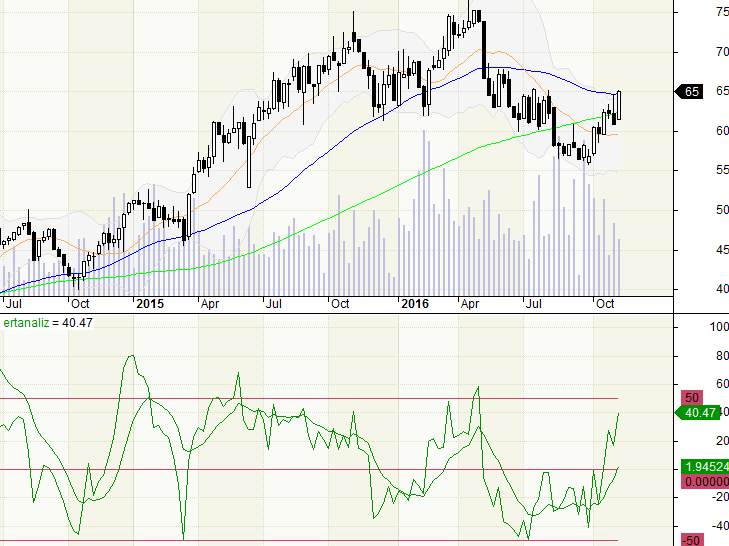
Shows overbought and oversold levels and divergences. look for 50, 0 and -50 levels. performs better in weekly charts.
Screenshots
Indicator / Formula
Copy & Paste Friendly
_SECTION_BEGIN("ertanaliz");

SumUp=Sum(IIf(C>Ref(C,-1),(C-Ref(C,-1)),0), 11);
SumDn=Sum(IIf(C<Ref(C,-1),(Ref(C,-1)-C),0), 11);

CMO=100*(SumUp-SumDn)/(SumUp+SumDn);
Plot(CMO,"ertanaliz",colorGreen,styleLine);

K1=Stdev(CMO,10);
K2=Stdev(CMO,20);
K3=Stdev(CMO,50);
K1*CMO+K2*CMO+K3*CMO/(K1+K2+K3);
ert=20;
CMOort=DEMA(CMO,ert);
trgAvg=5;
trigger=DEMA(CMOort,trgAvg);
Buy=Cross(CMOort,trigger);
Sell=Cross(trigger,CMOort) OR BarsSince(Buy)>=50;

Buy=ExRem(Buy,Sell);
Sell=ExRem(Sell,Buy);

Short=Cross(trigger,CMOort);
Cover=Cross(CMOort,trigger) OR BarsSince(Short)>=50;

Plot(CMOort,"Ortalama",colorGreen,-100,100);
Plot(50,"",15);
Plot(-50,"",15);
_SECTION_END();
1 comments
Leave Comment
Please login here to leave a comment.
This line is not used
K1*CMO+K2*CMO+K3*CMO/(K1+K2+K3);
any where. Is there any use.
Good indicator
—