Convergence pattern based on new ATR pivots for Amibroker (AFL)
empottasch over 9 years ago Amibroker (AFL)
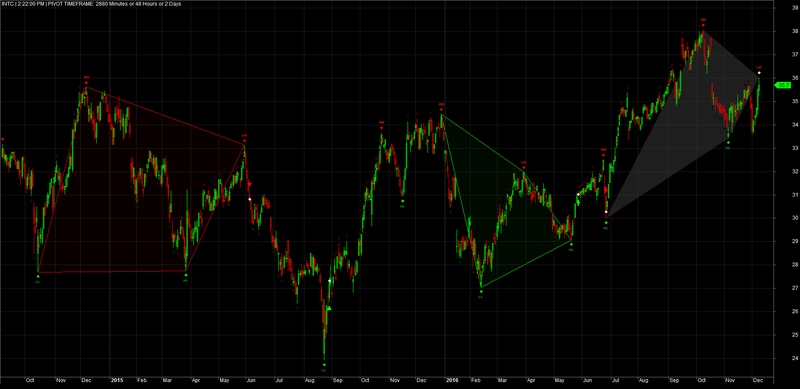
I posted similar code already but this code uses the Reverse() function to calculate the ATR pivots. Pivots can for instance be used to look for price patterns. In this case the code looks for “convergence” patterns. By default (see parameter window) it only shows bullish patterns. Once the pattern is confirmed (meaning it will not repaint) the color changes to green (bullish) or red (bearish). As soon as a pattern is confirmed a buy or a short signal will also appear in the chart.
In the example chart you see 3 patterns in the daily INTC chart. The last pattern is bearish but is still not completed and therefor still has a grayish color. The pattern could either be confirmed or disappear before it is confirmed.
Screenshots
Indicator / Formula
// "Convergence" Patterns, Amibroker AFL code, E.M.Pottasch, Nov 2016

GfxSetCoordsMode( 1 );
GfxSetOverlayMode( 1 );
x = BarIndex();
fvb = FirstVisibleValue( x );
lvb = LastVisibleValue( x );

perBull = Param( "Bullish ATR Period", 20, 1, 150, 1 );
perBear = Param( "Bearish ATR Period", 20, 1, 150, 1 );
multBull = Param( "Bullish ATR Multiple", 2, 1, 4, 0.05 );
multBear = Param( "Bearish ATR Multiple", 2, 1, 4, 0.05 );
trailValueClose = ParamToggle( "Trail value", "High/Low|Close", 1 );
//tfrm = in1Minute * Param( "Time Frame (min)", 5, 1, 1440 * 10, 1 ); // 1440 minutes is 1 day
tfrm = in1Minute * Interval() / 60 * Param( "Chart Time Frame Factor", 2, 1, 10, 1 ); // factor 1 uses timeframe of chart
tog2 = ParamToggle( "Show Trail", "No|Yes", 0 );
tog3 = ParamToggle( "Show Valid High/Low", "No|Yes", 0 );
tog4 = ParamToggle( "Show Labels", "No|Yes", 1 );
tog5 = ParamToggle( "Show Bullish Convergence Pattern", "No|Yes", 1 );
tog6 = ParamToggle( "Show Bearish Convergence Pattern", "No|Yes", 0 );

function ATRtrail_func()
{
    // Trail code largely from:
    // http://traders.com/Documentation/FEEDbk_docs/2009/06/TradersTips.html
    if( trailValueClose )
    {
        tvHigh = C;
        tvLow = C;
    }
    else
    {
        tvHigh = H;
        tvLow = L;
    }

    sup = tvHigh - multBull * ATR( perBull );
    res = tvLow + multBear * ATR( perBear );

    trailARRAY = Null;
    trailstop = 0;

    for( i = 1; i < BarCount; i++ )
    {
        if( C[ i ] > trailstop AND C[ i - 1 ] > trailstop )
            trailstop = Max( trailstop, sup[ i ] );
        else
            if( C[ i ] < trailstop AND C[ i - 1 ] < trailstop )
                trailstop = Min( trailstop, res[ i ] );
            else
                trailstop = IIf( C[ i ] > trailstop, sup[ i ], res[ i ] );

        trailARRAY[ i ] = trailstop;
    }

    return trailARRAY;
}

TimeFrameSet( tfrm );
trBull = multBull * ATR( perBull );
trBear = multBear * ATR( perBear );
trailArray = ATRtrail_func();
ts = IIf( trailArray > C, trailArray, Null ); // dntrend
tl = IIf( trailArray < C, trailArray, Null ); // uptrend
TimeFrameRestore();

ts = TimeFrameExpand( ts, tfrm, expandlast );
tl = TimeFrameExpand( tl, tfrm, expandlast );

lll = LLV( L, BarsSince( !IsEmpty( tl ) ) );
lll = IIf( ts, lll, Null );
trm = ts AND L == lll;

hhh = HHV( H, BarsSince( !IsEmpty( ts ) ) );
hhh = IIf( tl, hhh, Null );
pkm = tl AND H == hhh;

tr = ExRem( Reverse( trm ), Reverse( pkm ) );
pk = ExRem( Reverse( pkm ), Reverse( trm ) );

tr = Reverse( tr );
pk = Reverse( pk );

pkHigh = ValueWhen( trm, ValueWhen( pk, H, 1 ), 1 );
trLow = ValueWhen( pkm, ValueWhen( tr, L, 1 ), 1 );

for( i = 0; i < 3; i++ )
{
    VarSet( "px" + i, ValueWhen( pk, x, i ) );
    VarSet( "tx" + i, ValueWhen( tr, x, i ) );
    VarSet( "ph" + i, ValueWhen( pk, H, i ) );
    VarSet( "tl" + i, ValueWhen( tr, L, i ) );
    VarSet( "pxm" + i, ValueWhen( pkm, x, i ) );
    VarSet( "txm" + i, ValueWhen( trm, x, i ) );
    VarSet( "phm" + i, ValueWhen( pkm, H, i ) );
    VarSet( "tlm" + i, ValueWhen( trm, L, i ) );
}

ll = tr AND tl1 < tl2;
hl = tr AND tl1 > tl2;
hh = pk AND ph1 > ph2;
lh = pk AND ph1 < ph2;
dt = pk AND ph1 == ph2;
db = tr AND tl1 == tl2;

ll_h = IIf( ll, 1, 0 );
hl_h = IIf( hl, 2, 0 );
hh_h = IIf( hh, 3, 0 );
lh_h = IIf( lh, 4, 0 );
dt_h = IIf( dt, 5, 0 );
db_h = IIf( db, 6, 0 );

combi = ll_h + hl_h + lh_h + hh_h;

t0 = ValueWhen( combi, combi, 0 );
t1 = ValueWhen( combi, combi, 1 );
t2 = ValueWhen( combi, combi, 2 );
t3 = ValueWhen( combi, combi, 3 );
t4 = ValueWhen( combi, combi, 4 );

BuConv = tr AND t1 == 2 AND t2 == 4;
Buy = ( pkm AND t1 == 2 AND t2 == 4 )
      OR( pk AND t2 == 2 AND t3 == 4 );
BuyPrice = C;
Sell = trm;
SellPrice = C;
Buy = ExRem( Buy, Sell );
Sell = ExRem( Sell, Buy );

BeConv = pk AND t1 == 4 AND t2 == 2;
Short = ( trm AND t1 == 4 AND t2 == 2 )
        OR( tr AND t2 == 4 AND t3 == 2 );
ShortPrice = C;
Cover = pkm;
CoverPrice = C;
Short = ExRem( Short, Cover );
Cover = ExRem( Cover, Short );

GraphXSpace = 5;
SetChartBkColor( colorBlack );
SetChartOptions( 1, chartShowDates, chartGridMiddle, 0, 0, 0 );
SetBarFillColor( IIf( C > O, ColorRGB( 0, 75, 0 ), IIf( C <= O, ColorRGB( 75, 0, 0 ), colorLightGrey ) ) );
Plot( C, "", IIf( C > O, ColorRGB( 0, 255, 0 ), IIf( C <= O, ColorRGB( 255, 0, 0 ), colorLightGrey ) ), 64, Null, Null, 0, 0, 1 );

if( tog2 )
{
    Plot( ts, "", colorRed, styleStaircase | styleNoRescale, Null, Null, 0, 0, 1 );
    Plot( lll, "", colorRed, styleDashed | styleNoRescale, Null, Null, 0, 0, 1 );
    Plot( tl, "", colorGreen, styleStaircase | styleNoRescale, Null, Null, 0, 0, 1 );
    Plot( hhh, "", colorGreen, styleDashed | styleNoRescale, Null, Null, 0, 0, 1 );
}

if( tog3 )
{
    Plot( pkHigh, "", colorBlue, styleLine | styleNoRescale, Null, Null, 0, 0, 1 );
    Plot( trLow, "", colorRed, styleLine | styleNoRescale, Null, Null, 0, 0, 1 );
}

PlotShapes( shapeSmallCircle*trm, ColorRGB( 0, 30, 0 ), 0, L, -10 );
PlotShapes( shapeSmallCircle*pkm, ColorRGB( 50, 0, 0 ), 0, H, 10 );
PlotShapes( shapeSmallCircle*tr, IIf( ValueWhen( trm, x, 1 ) < ValueWhen( pkm, x, 0 ), ColorRGB( 0, 255, 0 ), ColorRGB( 255, 255, 255 ) ), 0, L, -10 );
PlotShapes( shapeSmallCircle*pk, IIf( ValueWhen( pkm, x, 1 ) < ValueWhen( trm, x, 0 ), ColorRGB( 255, 0, 0 ), ColorRGB( 255, 255, 255 ) ), 0, H, 10 );

function drawPivotLabels()
{
    sz = 5;

    for( i = lvb; i > fvb; i-- )
    {
        {
            if( ll[i] ) PlotTextSetFont( "LL", "Arial Black", sz, i, L[i], colorGreen, colorDefault, -25 );

            if( hl[i] ) PlotTextSetFont( "HL", "Arial Black", sz, i, L[i], colorGreen, colorDefault, -25 );

            if( db[i] ) PlotTextSetFont( "DB", "Arial Black", sz, i, L[i], colorLightBlue, colorDefault, -25 );

            if( hh[i] ) PlotTextSetFont( "HH", "Arial Black", sz, i, H[i], colorRed, colorDefault, 20 );

            if( lh[i] ) PlotTextSetFont( "LH", "Arial Black", sz, i, H[i], colorRed, colorDefault, 20 );

            if( dt[i] ) PlotTextSetFont( "DT", "Arial Black", sz, i, H[i], colorOrange, colorDefault, 20 );
        }
    }
}
function drawBuConvergence()
{
    for( i = lvb; i > fvb; i-- )
    {
        if( BuConv[i] )
        {
            if( txm1[i] < pxm0[i] )
            {
                GfxSelectPen( ColorRGB( 0, 255, 0 ), 1 );
                GfxSelectSolidBrush( ColorRGB( 0, 10, 0 ) );
            }
            else
            {
                GfxSelectPen( ColorRGB( 0, 60, 0 ), 1 );
                GfxSelectSolidBrush( ColorRGB( 30, 30, 30 ) );
            }

            GfxPolygon( tx1[i], tl1[i], tx2[i], tl2[i], px2[i], ph2[i], px1[i], ph1[i], tx1[i], tl1[i] );
        }
    }
}
function drawBeConvergence()
{
    for( i = lvb; i > fvb; i-- )
    {
        if( BeConv[i] )
        {
            if( pxm1[i] < txm0[i] )
            {
                GfxSelectPen( ColorRGB( 255, 0, 0 ), 1 );
                GfxSelectSolidBrush( ColorRGB( 10, 0, 0 ) );
            }
            else
            {
                GfxSelectPen( ColorRGB( 60, 0, 0 ), 1 );
                GfxSelectSolidBrush( ColorRGB( 30, 30, 30 ) );
            }

            GfxPolygon( tx1[i], tl1[i], tx2[i], tl2[i], px2[i], ph2[i], px1[i], ph1[i], tx1[i], tl1[i] );
        }
    }
}
Title = Name() +
        " | " + Now( 2 ) +
        " | " + "PIVOT TIMEFRAME: " + tfrm / 60 + " Minutes or " + tfrm / 3600 + " Hours or " + tfrm / ( 3600 * 24 ) + " Days ";

if( tog4 ) drawPivotLabels();

if( tog5 )
{
    drawBuConvergence();
    PlotShapes( IIf( Buy, shapeUpArrow, shapeNone ), colorBrightGreen, 0, L, -15 );
    PlotShapes( IIf( Buy, shapeSmallCircle, shapeNone ), colorWhite, 0, BuyPrice, 0 );
    PlotShapes( IIf( Sell, shapeDownArrow, shapeNone ), colorRed, 0, H, -15 );
    PlotShapes( IIf( Sell, shapeSmallCircle, shapeNone ), colorWhite, 0, SellPrice, 0 );
}

if( tog6 )
{
    drawBeConvergence();
    PlotShapes( IIf( Short, shapeSmallDownTriangle, shapeNone ), colorRed, 0, H, IIf( Short AND Sell, -30, -15 ) );
    PlotShapes( IIf( Short, shapeSmallCircle, shapeNone ), colorWhite, 0, ShortPrice, 0 );
    PlotShapes( IIf( Cover, shapeSmallUpTriangle, shapeNone ), colorBrightGreen, 0, L, IIf( Cover AND Buy, -30, -15 ) );
    PlotShapes( IIf( Cover, shapeSmallCircle, shapeNone ), colorWhite, 0, CoverPrice, 0 );
}
14 comments
Leave Comment
Please login here to leave a comment.
Syntax errors..
Getting Error
It works ok for me. No syntax error.
I use Amibroker v. 5.90
indeed joeoil, i wish these clowns wouldn’t start screaming for justice as they clearly didn’t even pay for Amibroker. I just explained that I used the Reverse() function. You need 5.9 for this or 5.8. Why don’t you clowns point me to a real error for a change.
very nice
nice work empottasch, thank you,,,,
Sir,
I have heard people talk highly of you & your techniques.
Is there any regular location where your old and new/updated ideas, codes, posts etc may be found.
Thanx.
thank you. No I just post occasionally some code. In this case it dawned on me I could use the Reverse() function on old code I had. It might also work for code I posted before using fractal type pivots. Will try that out.
Hi Ed Sir,
Your codes always simple and powerful.Thanks for sharing such a wonderful things.
Thanking you
Ramesh
Great community service spirit !!
dont work on ami 5 and 5.7
Dear frd
Can use code to scan?
It says Syntax errors ln=182 col=40 . Can anyone tell me what really it is.
You need to upgrade your Amibroker to a newer version.