AD Moving Average for Amibroker (AFL)
jaipal7786 over 9 years ago Amibroker (AFL)
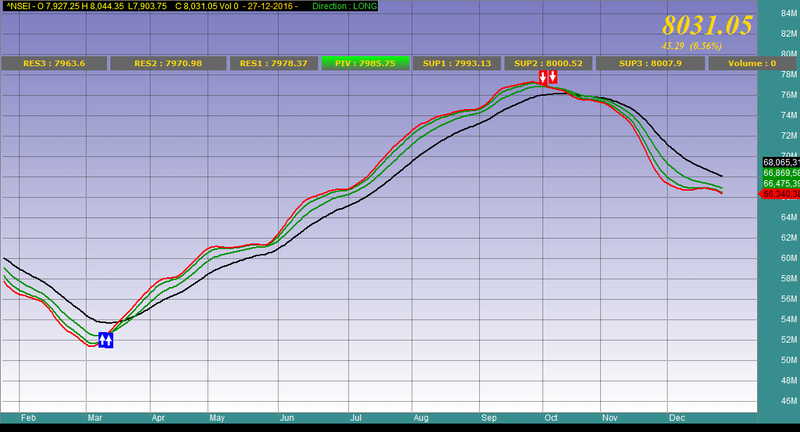
AD ma for long and short term trading….
Screenshots
Indicator / Formula
Copy & Paste Friendly
SetChartOptions(0, chartShowArrows | chartShowDates);

PaX = Param("Pr1",2, 2, 100, 1);
PaY = Param("Pr2",80, 2, 550, 1);


YCa2=TimeFrameGetPrice("ab3",3*in1Minute,-1)+ref(day(),-1)+BarsSince(Day());
yca=EMA(yca2,12)*EMA(EMA(C,7),12)  ;

SetChartOptions(0, chartShowArrows | chartShowDates);

 Plot(a=EMA(yca,6), "RS13", colorRed, 5);
 Plot(a1=EMA(yca,9), "RS13", colorGreen, 5);
 Plot(b=EMA(yca,16), "RS13", colorGreen, 5);
 Plot(b1=EMA(yca,30), "RS13", colorBlack, 5);


 Buy = Cover= Cross(a,a1 )OR Cross(a,b) ;
 Sell = Short= Cross(a1,a) OR Cross(b,a ) ;


 ss=b1;
// Backgraund color White
SetChartOptions(0, chartShowArrows | chartShowDates);

PlotShapes(IIf(Buy, shapeSquare, shapeNone),colorBlue, 0, ss, Offset=-20);
PlotShapes(IIf(Buy, shapeSquare, shapeNone),colorBlue, 0,ss, Offset=-30);
PlotShapes(IIf(Buy, shapeUpArrow, shapeNone),colorWhite, 0,ss, Offset=-25);
PlotShapes(IIf(Sell, shapeSquare, shapeNone),colorRed, 0, ss, Offset=20);
PlotShapes(IIf(Sell, shapeSquare, shapeNone),colorRed, 0,ss, Offset=30);
PlotShapes(IIf(Sell, shapeDownArrow, shapeNone),colorWhite, 0,ss, Offset=-25);

 for( i = 0; i < BarCount; i++ )
{
 if( Buy[i] )
 {

OUTcolor = ParamColor("Outer Panel Color",colorWhite);
INUPcolor = ParamColor("Inner Panel Upper",colorAqua);
INDNcolor = ParamColor("Inner Panel Lower",colorWhite);
TitleColor = ParamColor("Title Color ",colorBlack);
SetChartBkColor(OUTcolor); // color of outer border
SetChartBkGradientFill(INUPcolor,INDNcolor,TitleColor); // color of inner panel
}
if( Sell[i] )
{
OUTcolor = ParamColor("Outer Panel Color",colorTeal);
INUPcolor = ParamColor("Inner Panel Upper2",colorBlueGrey);
INDNcolor = ParamColor("Inner Panel Lower2",colorWhite);
TitleColor = ParamColor("Title Color ",colorBlack);
SetChartBkColor(OUTcolor); // color of outer border
SetChartBkGradientFill(INUPcolor,INDNcolor,TitleColor); // color of inner panel
}
}


Filter=Status("LastBarInTest");
Filter = Buy OR Sell;
//col3=IIf( buy>sell, colorBrightGreen, IIf( buy<sell, colorRed, 0 ));
_SECTION_END();
AddColumn( IIf( Buy, 66, 83 ), "Signal", formatChar );
 AddColumn(Close,"Close",1.2);
AddColumn(C-BuyPrice,"P / L",1.0);
AddColumn(SellPrice-C,"P / L",1.0);
AddColumn(Volume,"Volume",1.0);


//Magfied Market Price

FS=Param("Font Size",30,11,100,1);

GfxSelectFont("Times New Roman", FS, 700, True );

GfxSetBkMode( colorWhite );

GfxSetTextColor( ParamColor("Color",colorYellow) );

Hor=Param("Horizontal Position",940,1,1200,1);

Ver=Param("Vertical Position",12,1,830,1);

GfxTextOut(""+C, Hor , Ver );

YC=TimeFrameGetPrice("C",inDaily,-1);

DD=Prec(C-YC,2);

xx=Prec((DD/YC)*100,2);

GfxSelectFont("Times New Roman", 11, 700, True );

GfxSetBkMode( colorBlack );

GfxSetTextColor(ParamColor("Color",colorYellow) );

GfxTextOut(""+DD+"  ("+xx+"%)", Hor , Ver+45 );


_SECTION_END();


_SECTION_BEGIN("Pivot calc");

Long=Buy;//Flip(Buy,Sell);
Shrt=Sell;//Flip(Short,Cover);

pd = Param("Periods",13,5,144,1);
pds = 2*pd-1;//     (Adjustment for Wilders MA)
aa = Close-Ref(Close,-1);
uu = EMA(Max(0,aa),pds);
dd=  EMA((Max(0,0-aa)),pds);

rf = IIf(C>2,1000,10000);

c1 = Param("Upper Level",70,50,90,1);
qq1 =100/(100-c1)-1;
ff1 = qq1*dd-uu;
ff2 = ff1/qq1;
f1 = Max(ff1,ff2);
UL = Close + f1*(pds-1)/2;
UL = IIf(UL>C,floor(UL*rf),ceil(UL*rf))/rf;

c2 = Param("Equilibrium",50,50,50,0);
qq2 =100/(100-c2)-1;// [=1]
ff = dd-uu;
MM = Close + ff*(pds-1)/2;
MM = IIf(MM>C,floor(MM*rf),ceil(MM*rf))/rf;

c3 = Param("Lower Level",30,10,50,1);
qq3 =100/(100-c3)-1;
ff1 = qq3*dd-uu;
ff2 = ff1/qq3;
f3 = Min(ff1,ff2);
LL = Close + f3*(pds-1)/2;
LL = IIf(LL>C,floor(LL*rf),ceil(LL*rf))/rf;

band = Param("band width",4,0,15,0.25);
mmu = MM+band;
mmd = MM-band;


X=Cross( C,LL);
Y=Cross(UL,C);

Buy1= X ;
Sell1= Y ;

//TimeFrameSet( in15Minute*2 );
DH=Ref(H,-1);
DL=Ref(L,-1);
DC=Ref(C,-1);


pd = ( DH+ DL + DC )/3;
sd1 = (2*pd)-DH;
sd2 = pd -(DH - DL);
sd3 = Sd1 - (DH-DL);
rd1 = (2*pd)-DL;
rd2 = pd +(DH -DL);
rd3 = rd1 +(DH-DL);

//TimeFrameRestore();
/*
_SECTION_END();
BuyPrice=ValueWhen(Buy,C);

SellPrice=ValueWhen(Sell,C);

ShortPrice=ValueWhen(Short,C);

CoverPrice=ValueWhen(Cover,C);

*/
GraphXSpace = 25 ;
//---- pivot points
DayH = TimeFrameGetPrice("H", inDaily, -1); // yesterdays high
DayL = TimeFrameGetPrice("L", inDaily, -1); // low
DayC = TimeFrameGetPrice("C", inDaily, -1); // close
DayO = TimeFrameGetPrice("O", inDaily); // current day open

piv=(dayh+DayL+Dayc)/3;
//............camarilla pivots
H5 = ( (DayH-DayL) * (1.1/1) ) + DayC;
H4 = ( (DayH-DayL) * (1.1/2) ) + DayC;
H3 = ( (DayH-DayL) * (1.1/4) ) + DayC;
H2 = ( (DayH-DayL) * (1.1/6) ) + DayC;
H1 = ( (DayH-DayL) * (1.1/12) ) + DayC;
p1 = ( (dayc-dayo) * (1.1/12) ) + piv;
L1 = DayC - ( (DayH-DayL) * (1.1/12) );
L2 = DayC - ( (DayH-DayL) * (1.1/6) ) ;
L3 = DayC - ( (DayH-DayL) * (1.1/4) ) ;
L4 = DayC - ( (DayH-DayL) * (1.1/2) ) ;
piv1=(h1+l1)/2;

avc=WMA(Avg,1);

sidev = Param("sidea",1,0,1000,1);
distv = Param("si1v",-5,0,1000,1);
side = Param("side",1,0,1000,1);
dist = Param("si1p",0.5,0,1000,1);
dist1 = Param("si1",12,0,1000,1);
dist2 = Param("si2",9,0,1000,1);
dist3 = Param("si3",6,0,1000,1);
dist4 = Param("si4",3,0,1000,1);
dista = Param("si1a",-3,0,1000,1);
dist2a = Param("si2a",-6,0,1000,1);
dist3a = Param("si3a",-9,0,1000,1);
dist4a = Param("si4a",-12,0,1000,1);

X0 = PAX;
Y0 = PAY;

procedure DrawData (Text, x1, y1, x2, y2, colorFrom, colorTo)
{
	GfxSetOverlayMode(0);
	GfxSelectFont("Verdana", 8.5, 700);
	GfxSetBkMode(1);
	GfxGradientRect(x1, y1, x2, y2, colorFrom, colorTo);
	GfxDrawText(Text, x1, y1, x2, y2, 32|1|4|16);
}

DrawData ("RES3 : " + l3, X0, Y0, X0+150, Y0+20, colorGrey40, colorGrey40);
DrawData ("RES2 : " + l2, X0+155, Y0, X0+320, Y0+20, colorGrey40, colorGrey40);
DrawData ("RES1 : " + l1, X0+325, Y0, X0+450, Y0+20, colorGrey40, colorGrey40);
DrawData ("PIV : " + piv1, X0+455, Y0, X0+580, Y0+20, colorBrightGreen, colorGrey40);
DrawData ("SUP1 : " + h1, X0+585, Y0, X0+710, Y0+20, colorGrey40, colorGrey40);
DrawData ("SUP2 : " + h2, X0+715, Y0, X0+840, Y0+20, colorGrey40, colorGrey40);
DrawData ("SUP3 : " + h3, X0+845, Y0, X0+1000, Y0+20, colorGrey40, colorGrey40);
DrawData ("Volume : " + V, X0+1005, Y0, X0+1130, Y0+20, colorGrey40, colorGrey40);


Title =
EncodeColor(colorYellow)+ "" + "  " +  Name() + " - "  +"O "+WriteVal(O,1.2)+" "+"H "+WriteVal(H,1.2)+"  L"+WriteVal(L,1.2)+"    C "+WriteVal(C,1.2)+" Vol "+WriteVal(V,1.0)
+ EncodeColor(colorGold) +  "  - " + Date() +" - "
+ WriteIf ((c>O) ,EncodeColor(colorLime)+ "      Direction : LONG",EncodeColor(colorRed)+"      Direction : SHORT")
+"\n"
+ WriteIf (Sell , " EXIT LONG / Reverse Signal at "+C+"\n","")
+ WriteIf (Buy , " EXIT SHORT / Reverse Signal at "+C+"\n","")

+WriteIf(Sell , "Total Profit / Loss for the Last Trade Rs."+(C-BuyPrice)+"","")+
WriteIf(Buy , "Total Profit / Loss for the Last trade Rs."+(SellPrice-C)+"","");//+

WriteIf(Long AND NOT Buy,EncodeColor(colorLime)+  "Trade : Long - Entry price Rs."+(BuyPrice)+" Tgt : "+UL,"")+
WriteIf(shrt AND NOT Sell,EncodeColor(colorRed)+ "Trade : Short - Entry price Rs."+(SellPrice)+" Tgt : "+LL,"")+"\n"+
WriteIf(Long AND NOT Buy, "Current Profit / Loss Rs."+(C-BuyPrice)+"","")+
WriteIf(shrt AND NOT Sell, "Current Profit / Loss Rs."+(SellPrice-C)+"","")+
EncodeColor(colorBrightGreen)+   "\n R3 : "+ EncodeColor(colorWhite)+RD3
+ EncodeColor(colorBrightGreen)+   "\n R2 : "+ EncodeColor(colorWhite)+RD2
+ EncodeColor(colorBrightGreen)+   "\n R1 : "+ EncodeColor(colorWhite)+RD1 + EncodeColor(colorBrightGreen)+  "     UP TGT   : "+ EncodeColor(colorWhite)+UL
+ EncodeColor(colorBlue)+   "\n Pivot : "+ EncodeColor(colorWhite)+pd+ EncodeColor(colorBlue)+   "     MIDPOINT : "+ EncodeColor(colorWhite)+MM
+ EncodeColor(colorRed)+   "\n S1 : "+ EncodeColor(colorWhite)+SD1   + EncodeColor(colorRed)+    "     BOT TGT  : "+ EncodeColor(colorWhite)+LL
+ EncodeColor(colorRed)+   "\n S2 : "+ EncodeColor(colorWhite)+SD2
+ EncodeColor(colorRed)+   "\n S3 : "+ EncodeColor(colorWhite)+SD3;

Yh=TimeFrameGetPrice("h",5*in15Minute,-2);
Ya=TimeFrameGetPrice("avg",5*in15Minute,-2);
Yl=TimeFrameGetPrice("l",5*in15Minute,-2);
DDa=Prec(Yh,2);
DDb=Prec(Ya,5);
DDc=Prec(Yl,2);
//xx=Prec((DD/YC)*100,2);
//Plot (b71=EMA(dda,1), "60ema", colorRed,styleNoLabel);
//Plot (b72=EMA(ddb,1), "60ema", colorRed,styleNoLabel);
//Plot (b73=EMA(ddc,1), "60ema", colorRed,styleNoLabel);
2 comments
Leave Comment
Please login here to leave a comment.
enjoy trading friends….
Thanks for your AFL
Sir have you any AFL
for find only buy signal for EOD with your FORMULA (AD Moving Average)
I have 400+ STOCK
Every stock CHECK for BUY signal, this is impossible
So how can i found buy signal for today?
If you can please HELP me
shoncorner@gmail.com