Fibonacci Lucas Time Series : Forward and Reverse for Amibroker (AFL)
crave over 9 years ago Amibroker (AFL)
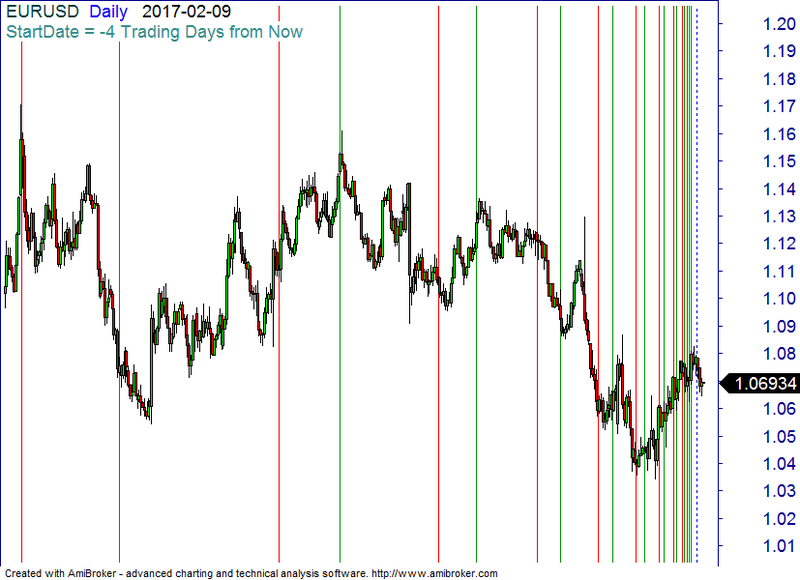
Fibonacci Lucas Time Series modified
to enable plotting both forward and backward series.
You can find a future focus bar also (blue dashed line).
Measurer included.
Play with Parameters in various time frames.
Enjoy the beauty of Time Golden Ratio !
Screenshots
Indicator / Formula
Copy & Paste Friendly
// Fibonacci Lucas Time Series : Forward and Backward
// Please choose Peaks or Troughs of a Zigzag
// Adjust the Start Bar by selecting a peak or trough as a begining of Time Series
// While choosing Backward Time Series adjust the future StartBar

_SECTION_BEGIN( "ZIGZAG PK TR" );
xx = Barindex();                                                                               // Actual Bar Number
BIL = LastValue( Barindex() );                                                          // Last Bar Number
ZigPerc = Param("ZIGZAG % CHANGE", 0.5, 0.05, 1, 0.05);
shift = Param("SHIFT FORWARD", 10,-20,50,1);
PK_OR_TR = ParamToggle("PEAKS / TROUGHS CHOICE", "TROUGHS|PEAKS", 1 );
FORWARD = ParamToggle("<< BACKWARD / FORWARD >>", "<< BACKWARD|FORWARD >>", 1 );

PK = PeakBars(H, ZigPerc)==0;
TR = TroughBars(L, ZigPerc)==0;

zzHi=Zig(H, ZigPerc);
zzLo=Zig(L, ZigPerc);
Avg=(zzHi + zzLo)/2;
ZZ = IIf(PK, zzHi, IIf(TR, zzLo, IIf( Avg > Ref(Avg,-1), H, L)));
zzHiLo=Zig(zz, ZigPerc);

Rev_Zig = Ref( Reverse( zzHiLo, first = 0, last = BarCount -1 ), -shift);
For_Zig = Reverse( Rev_Zig, first = 0, last = BarCount -1 );

PKBar = ValueWhen( PK, xx );
TRBar = ValueWhen( TR, xx );

ALLPKs = LastValue( Cum(PK) ) ;
ALLTRs = LastValue( Cum(TR) ) ;

PK_Nr = Param("Nr of PEAKS LOOKBACK", 44, 2, 150, 1);              // Number of Peaks analysed counting from End
TR_Nr = Param("Nr of TROUGHS LOOKBACK", 44, 2, 150, 1);        // Number of Troughs analysed counting from End

PK_Nr_StartBar = BIL - LastValue( PeakBars( H, ZigPerc, Min( ALLPKs - 1, PK_Nr ) + 1) ); // FIRST PK BAR in THE LAST PK_Nr RANGE
TR_Nr_StartBar = BIL - LastValue( TroughBars( L, ZigPerc, Min( ALLTRs - 1,TR_Nr ) + 1) ); // FIRST TR BAR in THE LAST TR_Nr RANGE

PK_Nr_StartBar_shifted = ( PK_Nr_StartBar - shift );
TR_Nr_StartBar_shifted = (TR_Nr_StartBar - shift );

PLOTZIG = ParamToggle("PLOT ZIGZAG", "PRICE ONLY|PLOT ZIGZAG", 1 );
_SECTION_END();

 ////////////////////////////////////////////////////

 _SECTION_BEGIN( "DATES" );
 //  Function changes DateNum ex:1040928 to String ddmmyyyy ex:28/09/2004
function sDate( nDate )
{
    string = StrFormat( "%07.07g", nDate );

    //extract string part
    aa = StrLeft( string, 3 );
    mm = StrMid( string, 3, 2 );
    dd = StrRight( string, 2 );

    //transform year en num
    aa1 = StrToNum( aa ) + 1900;
    yyyy = NumToStr( aa1, 1, False );

    result = yyyy + "-" + mm + "-" + dd;
    return result;
    }

PKStartDate = sDate( LastValue( ValueWhen( PK_Nr_StartBar ==xx, DateNum() ) ) );
TRStartDate = sDate( LastValue( ValueWhen( TR_Nr_StartBar ==xx, DateNum() ) ) );

LastStartBar = Ref( BIL, shift); // LAST BAR SHIFTED = FOCUS OF REVERSE SERIES
LastStartDate = DateTimeAdd( LastValue( DateTime() ), shift, inDaily );

_SECTION_END();

 ////////////////////////////////////////////////////

_SECTION_BEGIN("FIBONACCI LUCAS TIME SERIES");
if( FORWARD )
{
if( PK_OR_TR )
{ start = PK_Nr_StartBar_shifted;
StartDate = PKStartDate;
  }
else
{ start = TR_Nr_StartBar_shifted;
StartDate = TRStartDate;
 }
 }
 else
 {
 StartDate = Null;
 }

/////////////////////////////////////////////////////////////////////////////////////////////////////////

  function DrawSeries( start, series, Color )
{
  x = BarsSince( start == xx );
  result = 0;
  Plot( x == 0, "", colorBlue, styleHistogram | styleDashed | styleOwnScale | styleNoLabel| 2048, 0, 1, shift );
  for( k = 1; ( bar = StrToNum( StrExtract( series, k ) ) ) != 0; k++ )
  {
     result += x == bar;
   }
  Plot( result, "", Color, styleHistogram | styleOwnScale | styleNoLabel| 2048, 0, 1, shift );
}

  function DrawBackSeries( startback, series, Color )
{
  Plot( LastStartBar==xx, "", colorBlue, styleHistogram | styleDashed | styleOwnScale | styleNoLabel| 2048, 0, 1, shift);
  x = BarsSince( 0 == xx );
  result = 0;
  for( k = 0; ( bar = StrToNum( StrExtract( series, k ) ) ) != 0; k++ )
  {
     result += x == bar;
   }
  result = Reverse( result, first = 0, last = BarCount -1 );
  Plot( result, "", Color, styleHistogram | styleOwnScale | styleNoLabel| 2048, 0, 1, shift );
 }

FibSeries = "5,8,13,21,34,55,89,144,233,377,610,987,1597,2584,4181,6765,10946,17711,28657";
LucSeries = "3,4,7,11,18,29,47,76,123,199,322,521,843,1364,2207,3571,5778,9349,15127,24476";

FIB = ParamToggle("FIBON Series", "OFF|ON", 1 );
fibcolor = ParamColor("FIBON Color", colorRed );

LUC = ParamToggle("LUCAS Series", "OFF|ON", 1 );
luccolor = ParamColor("LUCAS Color", colorGreen );

//////////////////////////////////////////////

 Plot( C, "PRICE", colorBlack, styleCandle );

 if( PLOTZIG )
 {
 Plot( For_Zig, "", colorLightBlue, styleLine | styleThick | styleNoLabel, 0, 1, shift );
 }

if( FORWARD )
{
 if( FIB ) DrawSeries( start, FibSeries, fibcolor );
 if( LUC ) DrawSeries( start, LucSeries, luccolor );
 }
 else
 {
 if( FIB ) DrawBackSeries( shift, FibSeries, fibcolor );
 if( LUC ) DrawBackSeries( shift, LucSeries, luccolor );
 }
_SECTION_END();

//////////////////////////////////////////////////////////////////////////////////////////

_SECTION_BEGIN("Measurer");
if (ParamToggle("MEASURER ENABLED", "No|Yes", 1))
{
  EnableTextOutput(False);

  what = ParamList("Object", "Bar count|Price change (close)|Price change (high/low)|Average volume|Total volume|Average BW MFI", 0);
  mColor = ParamColor("Color", colorBlue);
  mStyle = ParamStyle("Style", styleLine | styleDashed, styleDashed | styleThick);
  mbgColor = ParamColor("Label Bg Color", colorWhite);
  showInTitle = ParamToggle("Show in title", "No|Yes", 1);

  SelectedBar = SelectedValue(BarIndex());
  StartRangeBar = BeginValue(BarIndex());
  FinishRangeBar = EndValue(BarIndex());

  // determine start & end of range
  if (StartRangeBar > 0 AND FinishRangeBar < BarCount - 1) // range defined by markers
  {
    start = StartRangeBar;
    end = FinishRangeBar;
  }
  else
  {
    if (StartRangeBar > 0) // range defined by start marker & selection
    {
      start = StartRangeBar;
      end = SelectedBar;
    }
    else // range defined by selected bar and end
    {
      start = SelectedBar;
      end = FinishRangeBar;
    }
  }
  if (start > end) { tmp = start; start = end; end = tmp; }

  // measuring
  switch (what)
  {
    // bar count
    case "Bar count":
      Value = end - start;
      Label = WriteVal(Value, 1.0);
      if (showInTitle) Title = "\n" + EncodeColor(mColor) + "Measuring bars: " + WriteVal(Value, 1.0);
      break;
    // price change (close)
    case "Price change (close)":
      Value = Close[end] - Close[start];
      Label = WriteVal(Value, 1.3);
      if (showInTitle) Title = "\n" + EncodeColor(mColor) + "Measuring price change (close): " + WriteVal(Value, 1.3);
      if (start != end) Plot(LineArray(start, Close[start], end, Close[end]), "", mColor, mStyle | styleNoLabel);
      break;
    // price change (high/low)
    case "Price change (high/low)":
      if (H[end] >= H[start])
        Value = H[end] - L[start];
      else
        Value = -(H[start] - L[end]);
      Label = WriteVal(Value, 1.3);
      if (showInTitle) Title = "\n" + EncodeColor(mColor) + "Measuring price change (high/low): " + WriteVal(Value, 1.3);
      if (start != end)
      {
        if (H[end] >= H[start])
          Plot(LineArray(start, L[start], end, H[end]), "", mColor, mStyle | styleNoLabel);
        else
          Plot(LineArray(start, H[start], end, L[end]), "", mColor, mStyle | styleNoLabel);
      }
      break;
    // Average volume
    case "Average volume":
      Bars = end - start + 1; // (inclusive)
      Value = 0;
      for (i = start; i <= end AND i < BarCount; i++) Value += Volume[i];
      Value = Value / Bars;
      Label = WriteVal(Value, 1.0);
      if (showInTitle) Title = "\n" + EncodeColor(mColor) + "Measuring average volume: " + WriteVal(Value, 1.0);
      break;
    // Total volume
    case "Total volume":
      Value = 0;
      for (i = start; i <= end AND i < BarCount; i++) Value += Volume[i];
      Value = Value;
      Label = WriteVal(Value, 1.0);
      if (showInTitle) Title = "\n" + EncodeColor(mColor) + "Measuring total volume: " + WriteVal(Value, 1.0);
      break;

    // Average BW MFI
    case "Average BW MFI":
      Bars = end - start + 1; // (inclusive)
      Value = 0;
      for (i = start; i <= end AND i < BarCount; i++) Value += 100000 * (High[i] - Low[i]) / Volume[i];
      Value = Value / Bars;
      fmt = 1;
      if (log10(Value) < 0) fmt += (-floor(log10(Value)) + 2) / 10;
      Label = WriteVal(Value, fmt);
      if (showInTitle) Title = "\n" + EncodeColor(mColor) + "Measuring average BW MFI: " + WriteVal(Value, fmt);
      break;
  }

  if (start != end)
  {
    // get highest visible value
    Hh = -1e8;
    for (i = Status("firstvisiblebarindex"); i < Status("lastvisiblebarindex") AND i < BarCount; i++)
    {
      if (H[i] > Hh) Hh = H[i];
    }
    VGrid = (Status("axismaxy") - Status("axisminy")) * 0.01;
    VH = Hh;
    Plot(LineArray(start, VH, end, VH), "", mColor, mStyle | styleNoLabel);
    PlotText(Label, start + (end - start) / 2 - 2, VH + VGrid, mColor, mbgColor);
  }
  EnableTextOutput(True);
}
_SECTION_END();

//////////////////////////////////////////////////////////////////////////////////////////////////////

Title =  "\\c18" + FullName()  + "  " + "\\c29" + WriteIf( Interval()/60==1440, "Daily ", WriteIf(Interval()/60==60,"Hourly ",  WriteIf(Interval()/60==15,"15 Min ",  WriteIf(Interval()/60==5,"5 Min ",  WriteIf(Interval()/60==1,"1 Min ", WriteIf(Interval()/60==5*1440,"Weekly ", WriteIf(Interval()/60== 25 *1440,"Monthly ", "" ) ) ) ) ) ) )
+ "  " +  "\\c16" + Date() + "  "
+ "\n" + "\\c17" + WriteIf( PK_OR_TR AND FORWARD, "PEAK StartDate = ", WriteIf( FORWARD, "TROUGH StartDate = ", "") ) + WriteIf( FORWARD, " " + StartDate, "" )
+ "\\c28" + WriteIf( NOT FORWARD AND Interval( 0 ) >= 3600, WriteIf( shift > 0, "Future ", "") +"StartDate = " + shift  + WriteIf( Interval() == inHourly, " Trading Hours", "") + WriteIf( Interval() == inDaily, " Trading Days", "")  + WriteIf( Interval() == inWeekly, " Weeks", "")  + WriteIf( Interval() == inMonthly, " Months", "") +" from Now", "")  ;
2 comments
Leave Comment
Please login here to leave a comment.
how to use this afl?
loads of syntax errors :(