Magical Trend Indicator for Amibroker (AFL)
trade12 about 9 years ago Amibroker (AFL)
credit goes to http://www.nascenttraders.com Mr. Rakesh Solanki
Very good trading system with buy/sell signal with less number of signals, thereby avoiding false signals.
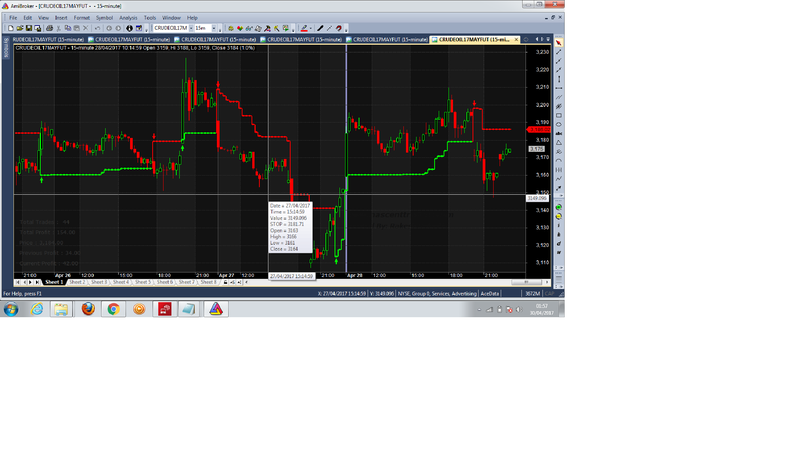
Screenshots
Indicator / Formula
Copy & Paste Friendly
/*Magical Trend Indicator with update
Created By : Rakesh Solanki
For www.nascenttraders.com
Date: 11/02/2017*/
_SECTION_BEGIN("Magic Trend Indicator Update");
SetBarsRequired(sbrAll,sbrAll);
SetFormulaName( "Magic Trend Indicator Update" );
SetOption( "Initialequity", 100000 );
SetOption( "AccountMargin", 0.25 );
SetOption( "MinShares", 1 );
MaxOpenPos = Param( "MaxOpenPos", 20, 1, 200, 1 );
SetOption( "MaxOpenPositions", MaxOpenPos );
SetOption( "PriceBoundChecking", 1 );
SetOption( "CommissionMode", 1 );
SetOption( "CommissionAmount", 0.01 );
PositionSize = -400 / ( MaxOpenPos );
P = Param("Period",20,2,25,1);
m = Param("Multiplier",3,0.1,5,0.1);
A = ATR(P);
for(i=0;i<P;i++)
{
 S[i] = C[i]-m*(A[i]);
 T[i] = 1;
}
for(i=P;i<BarCount;i++)
{
 if(C[i] > S[i-1])
 {
 if(T[i-1]==1)
 {
 S[i] = Max(C[i] - m*A[i],S[i-1]);
 T[i] = 1;
 }
 else
 {
 S[i] = C[i] - m*A[i];
 T[i] = 1;
 }

 }
 else
 {
 if(T[i-1]==-1)
 {
 S[i] = Min(C[i] + m*A[i],S[i-1]);
 T[i] = -1;
 }
 else
 {
 S[i] = C[i] + m*A[i];
 T[i] = -1;
 }
 }
}
Buy = Cover = C>S;
Short = Sell = C<S;
Buy = ExRem(Buy,Sell OR Short);
Sell = ExRem(Sell,Buy);
Short = ExRem(Short,Cover OR Buy);
Cover = ExRem(Cover,Short);
BuyPrice = ValueWhen(Buy,C,1);
SellPrice = ValueWhen(Sell,C,1);
ShortPrice = ValueWhen(Short,C,1);
CoverPrice = ValueWhen(Cover,C,1);
Offset = -12;
PlotShapes(Buy*shapeUpArrow,colorBrightGreen,0,Min(S,L),Offset);
PlotShapes(Short*shapeDownArrow,colorRed,0,Max(S,H),Offset);
PlotShapes(Cover*shapeHollowUpArrow,colorBrightGreen,0,Min(S,L),Offset);
PlotShapes(Sell*shapeHollowDownArrow,colorRed,0,Max(S,H),Offset);
SetChartOptions(0,chartShowArrows|chartShowDates);
_N(Title = StrFormat("{{NAME}} - {{INTERVAL}} {{DATE}} Open %g, Hi %g, Lo %g, Close %g (%.1f%%) {{VALUES}}", O, H, L, C, SelectedValue( ROC( C, 1 ) ) ));
Plot(S,"STOP",IIf(C>S,colorBrightGreen,colorRed),styleDots|styleStaircase|styleThick|styleNoTitle );
PlotOHLC(O,H,L,C,"Close",colorDefault,styleCandle|styleNoTitle);
GfxSetOverlayMode(1);
GfxSelectFont("Verdana", 12, 800, True );
GfxSetBkMode(0);
GfxSetTextColor(ColorRGB(18,18,18));
GfxTextOut("Created By: Rakesh Solanki", 800 , 430 );
GfxSelectFont("Verdana", 14, 800, True );
GfxSetBkMode(1);
GfxTextOut("www.nascenttraders.com" , 800 ,400 );
Open_Long = Flip( Buy, Sell );
Open_Short = Flip( Sell, Buy );
Buy_Price = ValueWhen( Buy, BuyPrice, 1 );
Short_Price = ValueWhen( Short, ShortPrice, 1 );
Sell_Price = IIf( Sell, ValueWhen( Sell, SellPrice, 1 ), Short_Price );
Cover_Price = IIf( Cover, ValueWhen( Cover, CoverPrice, 1 ), Buy_Price );
Profit = IIf( Open_Long, ( Close - Buy_Price ), IIf( Open_Short, ( Short_Price - Close ), 0 ) );
Last_Profit = IIf( Ref( Open_Long, -1 ) == 1 AND Open_Long != 1, ( Sell_Price - Buy_Price ), IIf( Ref( Open_Short, -1 ) == 1 AND Open_Short != 1, ( Short_Price - Cover_Price ), 0 ) );
Cum_Profit[0] = Last_Profit[0];
PreviousProfit = ValueWhen(Last_Profit!=0,Last_Profit,1);
for ( i = 1;i < BarCount;i++ )
{
 Cum_Profit[i] = Cum_Profit[i-1] + Last_Profit[i];
}
Trade[0] = 0;
for ( i = 1;i < BarCount;i++ )
{
 if ( Buy[i] == 1 OR Short[i] == 1 )
 {
 Trade[i] = Trade[i-1] + 1;
 }
 else
 {
 Trade[i] = Trade[i-1];
 }
}
// Trade Report //
TR = ParamToggle( "Trade Report", "Show|Hide", 1 );

if ( TR == 1 )
{
 GfxSelectFont( "Verdana", 10, 100 );
 GfxSetBkMode( 1 );
 GfxSetTextColor( ColorRGB(50,50,50) );
 y = Status( "pxchartheight" );

 GfxTextOut( ( "Total Trades : " + WriteVal( Trade, 3.0 ) ), 13, y - 125 );
 GfxTextOut( ( "Total Profit : " + WriteVal( Cum_Profit, 4.2 ) ), 13, y - 100 );
 GfxTextOut( ( "Previous Profit : " + WriteVal( PreviousProfit, 2.2 ) ), 13, y - 50 );
 GfxTextOut( ( "Price : " + WriteVal( Close, 2.2 ) ), 13, y - 75 );
 GfxTextOut( ( "Current Profit : " + WriteVal( Profit, 2.2 ) ), 13, y - 25 );
}
_SECTION_END();
4 comments
Leave Comment
Please login here to leave a comment.
How do i test this system…
exploration possible ?
It has Buy and Sell rules so you can run a scan.
Scan result gives the following error,
Error 10 Array subscription out of Range