Dynamic Support and Resistance for Amibroker (AFL)
dangnguyenduyngoc almost 9 years ago Amibroker (AFL)
I found this formula in one of the forum.
Thanks to the original Author
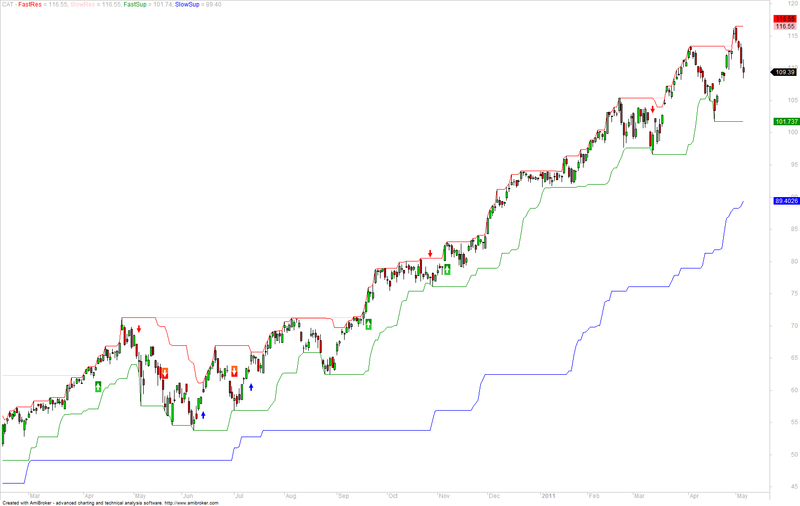
This indicator plots the dynamic support both a short term and long term support and resistance. It also has trading system rules to buy when the following conditions are met:
- The price breaks out above the short term resistance level.
- The positive directional indicator (+DI) is above 30
- The negative directional indicator (-DI) is less then 30
Screenshots
Indicator / Formula
Copy & Paste Friendly
_SECTION_BEGIN( "Support And Resistance for AmiBroker" );


SetChartOptions( 0, chartShowArrows | chartShowDates );
Plot( C, "Close", ParamColor( "Color", colorBlack ), styleNoTitle | ParamStyle( "Style" ) | GetPriceStyle() );

SetBarsRequired( 100000, 0 );
SetPositionSize(1, spsShares);

function Support(p)
{
	sup = LLV(Low, p);
	sup[0] = Low[0];
	for (i = 1; i < p; i++)
	{
		if(Low[i] < sup[i-1]) sup[i] = Low[i];
		else sup[i] = sup[i-1];
	}
	return sup;
}

function Resistance(p)
{
	res = HHV(High, p);
	res[0] = High[0];
	for (i = 1; i < p; i++)
	{
		if(High[i] > res[i-1]) res[i] = High[i];
	  	else res[i] = res[i-1];
	}
	return res;
}


fast = Param("Short-Term Periods", 15, 5, 105, 5);
slow = Param("Long-Term Periods", 100, 20, 420, 20);
FastRes = Resistance(fast);
FastSup = Support(fast);
SlowRes = Resistance(slow);
SlowSup = Support(slow);

	Plot(FastRes, "FastRes", colorRed);
	Plot(SlowRes, "SlowRes", colorPink);
	Plot(FastSup, "FastSup", colorGreen);
	Plot(SlowSup, "SlowSup", colorBlue);

PDI1= PDI(30);
MDI1= MDI(30);
Buy= H==FastRes  AND PDI1>30 AND MDI1<30;
Sell= L==FastSup AND Buy==0;
Buy = ExRem( Buy, Sell );
Sell = ExRem( Sell, Buy );

Short= L==FastSup AND  MDI1 >30 AND PDI1<30;
Cover=  H==FastRes AND Short==0;
Short = ExRem( Short, Cover );
Cover = ExRem( Cover, Short );


PlotShapes( IIf( Buy, shapeSquare, shapeNone ), colorGreen, 0, L, Offset = -40 );
PlotShapes( IIf( Buy, shapeSquare, shapeNone ), colorLime, 0, L, Offset = -50 );
PlotShapes( IIf( Buy, shapeUpArrow, shapeNone ), colorWhite, 0, L, Offset = -45 );
PlotShapes( IIf( Sell, shapeDownArrow, shapeNone ), colorRed, 0, H, Offset = -45 );
PlotShapes( IIf( Short, shapeSquare, shapeNone ), colorRed, 0, H, Offset = 40 );
PlotShapes( IIf( Short, shapeSquare, shapeNone ), colorOrange, 0, H, Offset = 50 );
PlotShapes( IIf( Short, shapeDownArrow, shapeNone ), colorWhite, 0, H, Offset = -45 );
PlotShapes( IIf( Cover, shapeUpArrow, shapeNone ), colorBlue, 0, L, Offset = -45 );

_SECTION_END();
4 comments
Leave Comment
Please login here to leave a comment.
Seems to work great when used with multiple timeframe.
When there is a buy / sell signal on the daily charts, the strategy can be applied on 5 min charts for good trades.
Long Signal: (Upward Arrow with green highlight)
Fast Resistance line merges with slow resistance line
Price starts breaking out above the resistance lines
(+DI) is more than 30
(-DI) is less than 30
For exit, blue downward arrow with no highlight
Short Signal: (Downward arrow with red highlight)
Fast support line merges with slow support line
Price starts breaking out below the support lines
(-DI) is more than 30
(+DI) is less than 30
For exit, blue upward arrow with no highlight
Good one. Thanks for sharing.
@dangnguyenduyngoc Thanks for sharing this great indicator.
@rustom.fracis1991 Thanks for the extra info.
thanks alot
I got an Error 10: array subscript out of range on this formula:
if(High[i] > res[i-1]) res[i] = High[i];please help. thankyou