Bottom Picker Using RSI and CMO for Amibroker (AFL)
manicminer over 8 years ago Amibroker (AFL)
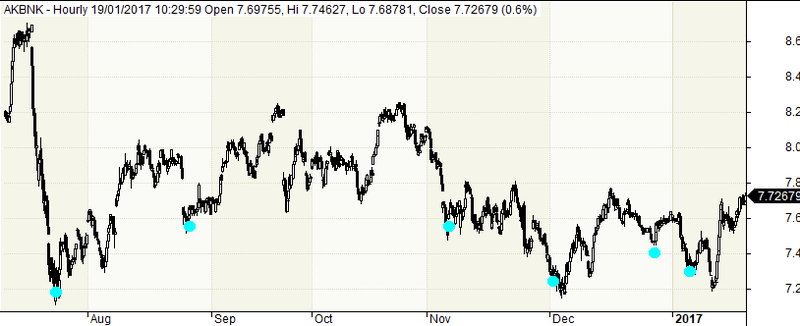
You can use in all time frames. But on hourly charts gives best results. Try to pick bottom points based on the following conditions:
- 14 day relative Strength Index has crossed the oversold zone of 30
- 20 day chande Momentum Oscillator has crossed the oversold zone of 50
- The 9 day moving average signal of the chande momentum oscillator has crossed above the oscillator.
Screenshots
Indicator / Formula
Copy & Paste Friendly
/*ertanaliz*/
//bottom picker

SetChartOptions( 0, chartShowArrows | chartShowDates );
_N( Title = StrFormat( "{{NAME}} - {{INTERVAL}} {{DATE}} Open %g, Hi %g, Lo %g, Close %g (%.1f%%) {{VALUES}}", O, H, L, C, SelectedValue( ROC( C, 1 ) ) ) );
Plot( C, "Close", ParamColor( "Color", colorDefault ), styleNoTitle | ParamStyle( "Style" ) | GetPriceStyle() );

SumUp = Sum( IIf( C > Ref( C, -1 ), ( C - Ref( C, -1 ) ), 0 ), 20 );
SumDn = Sum( IIf( C < Ref( C, -1 ), ( Ref( C, -1 ) - C ), 0 ), 20 );

CMO = 100 * ( SumUp - SumDn ) / ( SumUp + SumDn );

cmoSignal = Ma( CMO, 9 );
rsi14 = RSI( 14 );
sonuc = Cross(CMO, -50 ) AND CMO > cmoSignal AND Cross(rsi14, 30 );

PlotShapes( IIf( sonuc == 1, shapeCircle, Null ), 10);
4 comments
Leave Comment
Please login here to leave a comment.
güzel çalışma.teşekkürler.
EMEĞİNE YÜREĞİNE SAĞLIK….
I am a starter in amibroker.
How can I use this AFL?
I put this code in Formula Editor, saved and clicked on Optimization and then clicked on Backtest, but do nothing. :( I cant see the bottom points in my charts.
Thanks!
The indicator does not have any optimization or back-test code in it.