Master Nested Keltner Channel with Price Target levels for Amibroker (AFL)
manuadam over 8 years ago Amibroker (AFL)
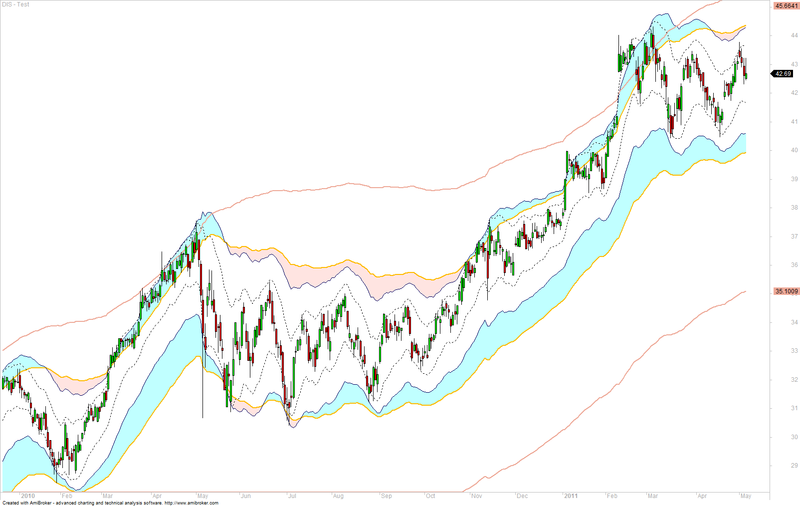
This is Nested Keltner Channel with Projected Price Target levels. It is a very optimized system of Keltner Channel and works very well in all time frame.
Keltner channel is a technical analysis indicator showing a central moving average line plus channel lines at a distance above and below. The indicator is named after Chester W. Keltner (1909–1998) who described it in his 1960 book How To Make Money in Commodities. This name was applied by those who heard about it from him, but Keltner called it the ten-day moving average trading rule and indeed made no claim to any originality for the idea.
The trading strategy is to regard a close above the upper line as a strong bullish signal, or a close below the lower line as strong bearish sentiment, and buy or sell with the trend accordingly, but perhaps with other indicators to confirm. Source Wikipedia
You can read about this system in detail here
Screenshots
Indicator / Formula
Apply to a new chart pane. Then go to parameters and enable the price display.
_SECTION_BEGIN( "KC Bands" );
SetChartOptions( 0, chartShowArrows | chartShowDates );
ShowCandles 		= ParamToggle( "Show Candles", "No|Yes", 0 );

if( ShowCandles )
{
    Plot( C, "", ParamColor( "Color", colorDefault ), GetPriceStyle() );
}

//Peaking Volumes
showVC = ParamToggle( "Show Volume on Candle", "No|Yes", 0 ) ;
HiVolume = IIf( V > ( 1.2 * MA( V, 10 ) ), True, False );

if( showVC )
{
    PlotShapes( shapeSmallCircle * HiVolume, IIf( C > O, colorBlack, colorWhite ), 0, ( O + C ) / 2, 0 );
    ToolTip = "Open = " + O + "\nHigh = " + H + "\nLow = " + L + "\nClose = " + C ;
}

// KC Parameters
ShowKC1    = ParamToggle( "Show KC1", "No|Yes", 1 );
ShowKC1Mid = ParamToggle( "Show KC1Mid", "No|Yes", 0 );
ShowKC2	   = ParamToggle( "Show KC2", "No|Yes", 0 );
ShowKC2Mid = ParamToggle( "Show KC2Mid", "No|Yes", 0 );
ShowKC3    = ParamToggle( "Show KC3", "No|Yes", 1 );
ShowKC3Mid = ParamToggle( "Show KC3Mid", "No|Yes", 0 );
ShowKC4	   = ParamToggle( "Show KC4", "No|Yes", 1 );
ShowKC4Mid = ParamToggle( "Show KC4Mid", "No|Yes", 0 );
ShowKCARR	   = ParamToggle( "Show KC ARR", "No|Yes", 0 );
ShowKC5	   = ParamToggle( "Show KC5", "No|Yes", 1 );
// KC1
P = ParamField( "Price field", -1 );
Period1 = Param( "Period1", 9, 2, 200, 1 );
Width1 = Param( "Width1", 1.4, 0, 10, 0.05 );
k1Color = ParamColor( "k1Color", colorBlack );
k1Style = ParamStyle( "k1Style", styleDashed | styleNoRescale | styleNoLabel );
MAType1 = Param( "MAType1", 2, 1, 2, 1 );

if( MAType1 == 1 )
{
    CenterLine1 = MA( P, Period1 );
}

if( MAType1 == 2 )
{
    CenterLine1 = EMA( P, Period1 );
}

if( ShowKC1Mid )
{
    Plot( CenterLine1, "", ParamColor( "kc1Mid Color", colorRed ), ParamStyle( "kc1Mid Style", styleLine ) );
}

KTop1   = CenterLine1 + Width1 * ATR( Period1 );
KBot1 = CenterLine1 - Width1 * ATR( Period1 );

if( ShowKC1 )
{
    Plot( KTop1, "", k1Color, k1Style );
    Plot( KBot1, "", k1Color, k1Style );
}

// KC2
Period2 = Param( "Period2", 45, 2, 300, 1 );
Width2 = Param( "Width2", 3, 0, 10, 0.05 );
k2Color = ParamColor( "k2Color", colorCustom14 );
k2Style = ParamStyle( "k2Style", styleThick | styleNoRescale );
MAType2 = Param( "MAType2", 2, 1, 2, 1 );

if( MAType2 == 1 )
{
    CenterLine2 = MA( P, Period2 );
}

if( MAType2 == 2 )
{
    CenterLine2 = EMA( P, Period2 );
}

if( ShowKC2Mid )
{
    Plot( CenterLine2, "", ParamColor( "kc2Mid Color", colorRed ), ParamStyle( "kc2Mid Style", styleLine ) );
}

KTop2   = CenterLine2 + Width2 * ATR( Period2 );
KBot2 = CenterLine2 - Width2 * ATR( Period2 );

if( ShowKC2 )
{
    Plot( KTop2, "", k2Color, k2Style );
    Plot( KBot2, "", k2Color, k2Style );
}

// KC3
Period3 = Param( "Period3", 120, 2, 300, 1 );
Width3 = Param( "Width3", 7.2, 0, 10, 0.05 );
k3Color = ParamColor( "k3Color", colorCustom14 );
k3Style = ParamStyle( "k3Style", styleThick | styleNoRescale );
MAType3 = Param( "MAType3", 2, 1, 2, 1 );

if( MAType3 == 1 )
{
    CenterLine3 = MA( P, Period3 );
}

if( MAType3 == 2 )
{
    CenterLine3 = EMA( P, Period3 );
}

if( ShowKC3Mid )
{
    Plot( CenterLine3, "", ParamColor( "kc3Mid Color", colorRed ), ParamStyle( "kc3Mid Style", styleLine ) );
}

KTop3   = CenterLine3 + Width3 * ATR( Period3 );
KBot3 = CenterLine3 - Width3 * ATR( Period3 );

if( ShowKC3 )
{
    Plot( KTop3, "", k3Color, k3Style );
    Plot( KBot3, "", k3Color, k3Style );
}

// KC4
Period4 = Param( "Period4", 20, 2, 300, 1 );
Width4 = Param( "Width4", 2.5, 0, 10, 0.05 );
k4Color = ParamColor( "k4Color", colorDarkTeal );
k4Style = ParamStyle( "k4Style", styleLine | styleNoRescale | styleNoLabel );
MAType4 = Param( "MAType4", 2, 1, 2, 1 );

if( MAType4 == 1 )
{
    CenterLine4 = MA( P, Period4 );
}

if( MAType4 == 2 )
{
    CenterLine4 = EMA( P, Period4 );
}

if( ShowKC4Mid )
{
    Plot( CenterLine4, "", ParamColor( "kc4Mid Color", colorRed ), ParamStyle( "kc4Mid Style", styleLine ) );
}

KTop4   = CenterLine4 + Width4 * ATR( Period4 );
KBot4 = CenterLine4 - Width4 * ATR( Period4 );

if( ShowKC4 )
{
    Plot( KTop4, "", k4Color, k4Style );
    Plot( KBot4, "", k4Color, k4Style );
}

// KC5
Period5 = Param( "Period5", 45, 2, 300, 1 );
Width5 = Param( "Width5", 3, 0, 10, 0.05 );
k5Color = ParamColor( "k5Color", colorCustom10 );
k5Style = ParamStyle( "k5Style", styleThick | styleNoRescale | styleNoLabel );
MAType5 = Param( "MAType5", 2, 1, 2, 1 );

if( MAType5 == 1 )
{
    CenterLine5 = MA( P, Period5 );
}

if( MAType5 == 2 )
{
    CenterLine5 = EMA( P, Period5 );
}

KTop5   = CenterLine5 + Width5 * ATR( Period5 );
KBot5 = CenterLine5 - Width5 * ATR( Period5 );

if( ShowKC5 )
{
    Plot( KTop5, "", k5Color, k5Style );
    Plot( KBot5, "", k5Color, k5Style );
}

// KC Trend Bands
showkcbband = ParamToggle( "Show KCB Trend Bands", "No|Yes", 0 ) ;
RefKTop4 = KTop4;
RefKBot4 = KBot4 ;
RefKTop5 = KTop5;
RefKBot5 = KBot5;
kcblayer = Param( "KCB Layer", -3, -5, 5, 1 ) ;

if( showkcbband )
{
    PlotOHLC( RefKBot5, RefKBot5, RefKBot4, RefKBot4, "", ParamColor( "Down Trend", colorRose ), styleCloud | styleNoLabel | styleNoRescale, 0, 0, 0, kcblayer ) ;
    PlotOHLC( RefKTop5, RefKTop5, RefKTop4, RefKTop4, "", ParamColor( "Up Trend", colorSkyblue ), styleCloud | styleNoLabel | styleNoRescale, 0, 0, 0, kcblayer ) ;
}

// KCB Rider
ShowKbcR = ParamToggle( "Show KbcR", "No|Yes", 1 ) ;
ShowKbcS = ParamToggle( "Show KbcS", "No|Yes", 1 ) ;
Color1 = ParamColor( "Color1", colorSkyBlue );
Color2 = ParamColor( "Color2", colorRose );
ColR = IIf( RefKTop4 > RefKTop5, color1, color2 );
ColS = IIf( RefKBot4 > RefKBot5, color1, color2 );

if( ShowKbcR )
{
    PlotOHLC( RefKTop4, RefKTop4, RefKTop5, RefKTop5, "", ColR,  styleCloud | styleNoLabel | styleNoRescale, 0, 0, 0, kcblayer );
}

if( ShowKbcS )
{
    PlotOHLC( RefKBot4, RefKBot4, RefKBot5, RefKBot5, "", ColS,  styleCloud | styleNoLabel | styleNoRescale, 0, 0, 0, kcblayer );
}

// KCARR
x1 = x2 = y1 = y2 = 0 ;
// Buycol = ParamColor("BuyColor", colorBlue);
// Sellcol = ParamColor("SellColor", colorRed);
x1 = KTop1 ;
x2 = KTop4 ;
y1 = KBot1 ;
y2 = KBot4 ;
a = Cross( y2, y1 );
b = Cross( x1, x2 );
Buy = a;
Sell = b;

if( ShowKCARR )
{
// PlotShapes( shape, IIf( Buy, Buycol, Sellcol ), 0, IIf( Buy, Low, High ), -30 );
    PlotShapes( IIf( Buy, shapeUpTriangle, shapeNone ), colorBlue, 0, L, Offset = -35 );
    PlotShapes( IIf( Sell, shapeDownTriangle, shapeNone ), colorRed, 0, H, Offset = -35 );
}

_SECTION_END();
5 comments
Leave Comment
Please login here to leave a comment.
Hi,
i checked your work. it good coding… but i am getting errors on line 206 & 211.
Below are the two….
206 ==>
PlotOHLC( RefKTop4, RefKTop4, RefKTop5, RefKTop5, "", ColR, styleCloud | styleNoLabel | styleNoRescale, 0, 0, 0, kcblayer );211 ==>
PlotOHLC( RefKBot4, RefKBot4, RefKBot5, RefKBot5, "", ColS, styleCloud | styleNoLabel | styleNoRescale, 0, 0, 0, kcblayer );Error is : – Error 16, Too Many arguments
Can you please check and let me know..
Your version of Amibroker is probably a bit too old. Try removing the last 4 parameters for those function calls.
hi Admin, can you advise which 4 should be removed. i am waste at coding.
Just remove
0, 0, 0, kcblayerfrom those lines.very good afl