Cubic Splines for Amibroker (AFL)
piptrader over 8 years ago Amibroker (AFL)
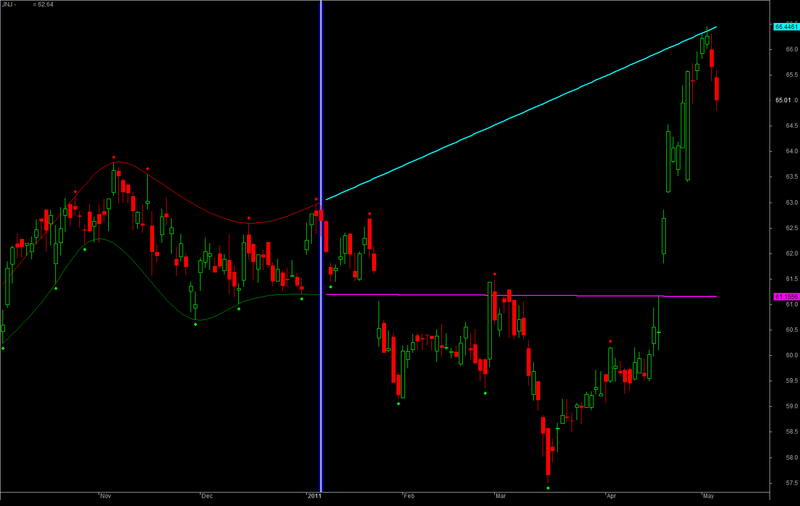
This indicator is written by E.M.Pottasch for the 64bit and 32bit versions of Amibroker. If you are running the 64bit version of Amibroker you need to place SplineGroup64.dll into the C:\Program Files\Amibroker\Plugin directory to get it to work. If you are running the 32bit version of Amibroker you need to place SplineGroup32.dll into the C:\Program Files (x86)\Amibroker\Plugin directory to get it to work. The indicator should be used as follows. You click on a spot on the chart. The indicator will then calculate the cubic splines up to the bar you selected and project the computed splines after the selected bar. If the price chart follows a predictable pattern you can use the splines as a guide for where the price may be in the future.
You can check out his site here
Screenshots
Files
Indicator / Formula
/*
© AFL code by E.M.Pottasch, 11/2017

Example of extended spline

DLL programming using:
Cubic Spline http://kluge.in-chemnitz.de/opensource/spline/
*/

rightstrength = Param( "Right Strength", 5, 2, 50, 1 );
leftstrength = Param( "Left Strength", 5, 2, 50, 1 );
fact = Param( "Chart Time Frame Factor", 1, 1, 10, 1 );

bi = BarIndex();
fvb = FirstVisibleValue( bi );
lvb = LastVisibleValue( bi );

rightStrength = rightStrength * fact;
leftStrength = leftStrength * fact;

pk = H == HHV( H, leftstrength ) AND Ref( HHV( H, rightstrength ), rightstrength ) < H;
tr = L == LLV( L, leftstrength ) AND Ref( LLV( L, rightstrength ), rightstrength ) > L;

SetChartOptions( 0, chartShowDates );
SetChartBkColor( ColorRGB( 0, 0, 0 ) );
Plot( Close, "Price", colorDefault, styleCandle, Null, Null, 0, 0, 1 );
PlotShapes( shapeSmallCircle*tr, ColorRGB( 0, 250, 0 ), 0, L, -10 );
PlotShapes( shapeSmallCircle*pk, ColorRGB( 250, 0, 0 ), 0, H, 10 );

dn = DateTime();
sd = SelectedValue( dn );
start = dn == sd;
stidx = LastValue( ValueWhen( start, BarIndex() ) );

// Spline calculations
top = extendtop = xarr = yarr = Null;
cnt = 0;

for( i = fvb; i <= stidx; i++ )
{
    if( pk[i] )
    {
        xarr[cnt] = bi[i];
        yarr[cnt] = H[i];
        cnt = cnt + 1;
    }
}

for( i = fvb; i <= stidx; i++ )
{
    if( cnt > 0 )
        top[i] = empSpline( xarr, yarr, cnt, i );
}

for( i = stidx + 1; i <= lvb; i++ )
{
    if( cnt > 0 )
        extendtop[i] = empSpline( xarr, yarr, cnt, i );
}

Plot( top, "", colorRed, styleLine | styleNoRescale, Null, Null, 0, 0, 1 );
Plot( extendtop, "", ColorRGB( 0, 255, 255 ), styleLine | styleNoRescale, Null, Null, 0, 0, 2 );

bot = extendbot = xarr = yarr = Null;
cnt = 0;

for( i = fvb; i <= stidx; i++ )
{
    if( tr[i] )
    {
        xarr[cnt] = bi[i];
        yarr[cnt] = L[i];
        cnt = cnt + 1;
    }
}

for( i = fvb; i <= stidx; i++ )
{
    if( cnt > 0 )
        bot[i] = empSpline( xarr, yarr, cnt, i );
}

for( i = stidx + 1; i <= lvb; i++ )
{
    if( cnt > 0 )
        extendbot[i] = empSpline( xarr, yarr, cnt, i );
}

Plot( bot, "", colorGreen, styleLine | styleNoRescale, Null, Null, 0, 0, 1 );
Plot( extendbot, "", ColorRGB( 255, 0, 255 ), styleLine | styleNoRescale, Null, Null, 0, 0, 2 );
Plot( bi == stidx, "", colorDarkBlue, styleHistogram | styleOwnScale | styleNoLabel | styleNoRescale, 0, 1, 0, -2, 10 );
8 comments
Leave Comment
Please login here to leave a comment.
error in
Ln:53, Col:27 :Error 32,Syntax error unexpected
Ln:59, Col:33 :Error 32,Syntax error unexpected
Ln:81, Col:27 :Error 32,Syntax error unexpected
Ln:87, Col:33 :Error 32,Syntax error unexpected
You havn’t installed the plugin correctly.
I have put the dll file inside the plugin folder (C:\Program Files (x86)\AmiBroker\Plugins)
Even after that i am getting the error
Error 30,sytax error, empspline is undefined
Looks like you have 32bit version of Amibroker. You need to put SplineGroup32.dll in your plugin directory. If it still doesn’t work then the plugin is not loading. Most likely because your version of Amibroker is too old.
Thanks for your reply @administrator
I have put SplineGroup32.dll only in plugin folder.
I also felt that my amibroker version is giving this problem. I will update my amibroker version and will let you know.
Thank you very much
What’s your Amibroker’s version? Does your code work with version 6.00.2?
According to Ed this code is for illustration purposes only and may not be of any use for trading.
@mdsayeem @hmsanil for older version following code will work
I am still using 5.50