Least Squares Polynomial Fit Pattern Detection for Amibroker (AFL)
newman over 8 years ago Amibroker (AFL)
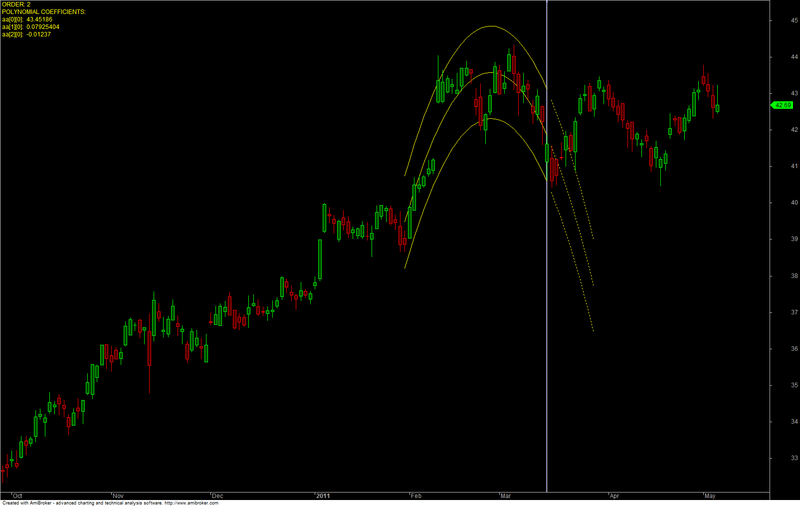
I found this indicator here it is written by E.M.Pottasch it attempts to find the best fitting polynomial to the selected point on the price chart. This formula requires a recent version of Amibroker as it uses the new matrix functions.
Screenshots
Indicator / Formula
Copy & Paste Friendly
SetBarsRequired( sbrall, sbrall );
s1 = GetChartID() + StrToNum( Name() );

order = Param( "n-th Order", 2, 1, 10, 1 );
nbar = Param( "Lookback nbars", 30, 10, 2000, 1 );
clevel = Param( "Confidence Level", 2, 1, 3, 0.1 );
extend = Param( "Extend Fit (Bars)", 10, 0, 20, 1 );
trig = ParamTrigger( "Force Calculation", "Press Here" );
lengthDev = Param( "Pattern Deviation Length (%)", 100, 0, 200, 1 );
cofDev = Param( "Coefficient Deviation (%)", 5, 0, 10, 0.5 );
clr = ParamTrigger( "Clear Patterns", "Press Here" );

aa = 0;// declare coefficient matrix as global

x = BarIndex();
sv = selectedvalue( x );

eb1 = sv; // endbar of pattern to look for
bars1 = nbar;
prc = C;

SetChartOptions( 0, chartShowDates );
SetChartBkColor( ColorRGB( 0, 0, 0 ) );
SetBarFillColor( IIf( C > O, ColorRGB( 0, 75, 0 ), IIf( C <= O, ColorRGB( 75, 0, 0 ), colorLightGrey ) ) );
Plot( C, "", IIf( C > O, ColorRGB( 0, 255, 0 ), IIf( C <= O, ColorRGB( 255, 0, 0 ), colorLightGrey ) ), styleCandle, Null, Null, 0, 0, 1 );

function get_y( eb, bars )
{
    fb = eb - bars;
    yy = Matrix( bars + 1, 1, 0 );

    yy = MxSetBlock( yy, 0, bars, 0, 0, Ref( prc, fb ) );

    return yy;
}
function get_x( eb, bars )
{
    xx = Matrix( bars + 1, order + 1, 1 );
    x = BarIndex() - bars / 2;

    for( j = 1; j <= order; j++ )
    {
        xx = MxSetBlock( xx, 0, bars, j, j, x ^ j );
    }

    return xx;
}
function calculateCoefficients( eb, bars )
{
    xx = get_x( eb, bars );
    yy = get_y( eb, bars );
    xxt = MxTranspose( xx );
    aa = MxSolve( xxt @ xx, xxt ) @ yy;

    return aa;
}
function calculateFit( eb, bars )
{
    global rr;
    global xxa;
    global zza;
    global rrext;
    global rrextxxa;
    global rrextzza;

    rr = rrext = Null; // store the fit in rr
    lb = eb;
    fb = eb - bars;

    x = BarIndex() - bars / 2;

    // calculate coefficients
    aa = calculateCoefficients( eb, bars );

    // store the fit in rr
    for( i = fb; i <= lb; i++ )
    {
        rr[i] = aa[0][0];

        for( j = 1; j <= order; j++ )
        {
            rr[i] += aa[j][0] * x[ i - fb ] ^ j;
        }
    }

    // extended fit (only when channel is active at last bar)
    if( lb == eb )
    {
        for( i = lb + 1; i <= lb + extend; i++ )
        {
            rrext[i - extend] = aa[0][0];

            for( j = 1; j <= order; j++ )
            {
                rrext[i - extend] += aa[j][0] * x[ i - fb ] ^ j;
            }
        }
    }

    // calculate standard deviation
    sdp = 0;

    for( i = fb; i <= lb; i++ )
    {
        sdp = sdp + ( prc[i] - rr[i] ) ^ 2;
    }

    sd = sqrt( sdp / ( bars - 2 ) ); // devide by ( bars - 2 ) corresponding to StdErr function

    xxa = rr + sd * clevel;
    zza = rr - sd * clevel;
    rrextxxa = rrext + sd * clevel;
    rrextzza = rrext - sd * clevel;
}

calculateFit( eb1, bars1 );

Plot( rr, "", colorYellow, styleLine, Null, Null, 0, 0, 1 );
Plot( xxa, "", colorYellow, styleline, null, null, 0, 0, 1 );
Plot( zza, "", colorYellow, styleline, null, null, 0, 0, 1 );
Plot( rrext, "", colorYellow, styleDashed | styleNoLabel | styleNoRescale, Null, Null, extend, 0, 1 );
Plot( rrextxxa, "", colorYellow, styleDashed | styleNoLabel | styleNoRescale, Null, Null, extend, 0, 1 );
Plot( rrextzza, "", colorYellow, styleDashed | styleNoLabel | styleNoRescale, Null, Null, extend, 0, 1 );
lastBarOfFit = eb1 == BarIndex();
Plot( lastbarOfFit, "", ColorRGB( 100, 100, 100 ), styleHistogram | styleThick | styleOwnScale | styleNoLabel, 0, 1, 0, 0, 1 );

str = "ORDER: " + order + "\n" + "POLYNOMIAL COEFFICIENTS:\n";

for( i = 0; i <= order; i++ )
{
    str = str + "aa[" + i + "][0]" + ":  " + aa[i][0] + "\n";
}

Title = EncodeColor( colorYellow ) + str + EncodeColor( colorBlack ) ;

minLength = round( bars1 - bars1 * ( 0.5 * lengthDev / 100 ) );
maxLength = round( bars1 + bars1 * ( 0.5 * lengthDev / 100 ) );

aap = aa; // coefficients of pattern to search for

// trigger to search for mathing patterns in the entire data array
if( trig )
{
    storeEndBar = 0;
    storeBars = 0;
    Say( "Calculation Started" );
    cnt = 0;

    for( i = maxlength + 1; i < barcount; i++ )
    {
        for( j = minlength; j < maxlength; j++ )
        {
            calculateFit( i, j );
            cnt2 = 0;

            for( k = 1; k <= order; k++ )
            {
                if( aa[k][0] > aap[k][0] - cofDev * aap[k][0] / 100 AND aa[k][0] < aap[k][0] + cofDev * aap[k][0] / 100 )
                {
                    cnt2 = cnt2 + 1;

                    //if( C[i] < zza[i] AND C[i - 1] > zza[i - 1] AND cnt2 == order )
                    if( cnt2 == order )
                    {
                        storeEndBar[ cnt ] = i;
                        storeBars[ cnt ] = j;
                        cnt = cnt + 1;
                    }
                }
                else
                    if( aa[k][0] < aap[k][0] - cofDev * aap[k][0] / 100 AND aa[k][0] > aap[k][0] + cofDev * aap[k][0] / 100 )
                    {
                        cnt2 = cnt2 + 1;

                        //if( C[i] > xxa[i] AND C[i - 1] < xxa[i - 1] AND cnt2 == order )
                        if( cnt2 == order )
                        {
                            storeEndBar[ cnt ] = i;
                            storeBars[ cnt ] = j;
                            cnt = cnt + 1;
                        }
                    }
            }
        }
    }

    StaticVarSet( "storeEndBar" + s1, storeEndBar );
    StaticVarSet( "storeBars" + s1, storeBars );
    Say( "Finished" );
}

storeEndBar1 = StaticVarGet( "storeEndBar" + s1 );
storeBars1 =   StaticVarGet( "storeBars" + s1 );

// avoid plot called too often in loop
lv = LastValue( ValueWhen( storeBars1 != 0, BarIndex() ) );
fv = Max( 0, lv - 160 );

for( i = lv; i > fv; i-- )
{
    if( IsEmpty( storeBars1[i] ) )
    {
        break;
    }
    else
        if( !IsEmpty( storeBars1[i] ) AND storeBars1[i] >= minlength )
        {
            a = storeEndBar1[ i ];
            b = storeBars1[ i ];
            calculateFit( a, b );

            Plot( rr, "", colorBlue, styleLine | stylenolabel, Null, Null, 0, 0, 2 );
            Plot( zza, "", colorBlue, styleLine | stylenolabel, Null, Null, 0, 0, 2 );
            Plot( xxa, "", colorBlue, styleLine | stylenolabel, Null, Null, 0, 0, 2 );
        }
}

if( clr )
{
    StaticVarSet( "storeEndBar" + s1, Null );
    StaticVarSet( "storeBars" + s1, Null );
}
4 comments
Leave Comment
Please login here to leave a comment.
@admin
12 errors coming in this code….i am using ami 6.0
can you please fix this?
Looking at the formula it uses the new matrix functions. I believe they are only available in Amibroker 6.10 and newer.
oohh..okay thanks @admin
Nice concept.
Where to tie this in mind’s analysis framework.
Thanx.