K-Trend Indicator for Amibroker (AFL)
whiz over 8 years ago Amibroker (AFL)
This indicator was created by Karthik Marar. It is based on the True Strength Index (TSI) indicator and has two versions. The first version uses exponential moving averages as is called for in the original TSI formula and a modified version, which uses adaptive moving averages instead of simple exponential moving averages. The two versions can be selected via the parameters.
The various conditions, like entry and exit are determined using the ‘Ravi’ indicator and the ‘Linear Regression Slope’.
Some Information about what is displayed by the indicator:
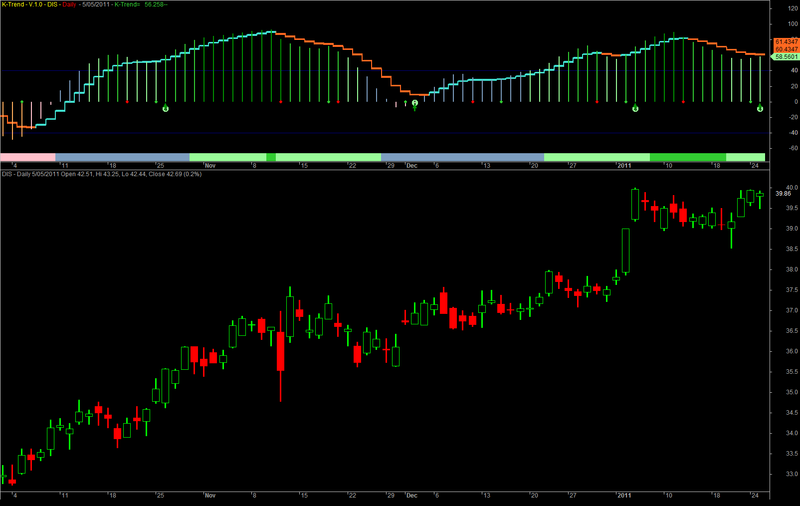
- The histogram is the main K-Trend indicator that is based on the TSI indicator. The different colors on the histogram are based on where its value falls within the range. For example, when the histogram value is below -80 it is dark red. The ribbon at the bottom provides the same information.
- The signal line is a 6 day exponential moving average of the K-Trend. When the signal greater then the K-Trend it is orange otherwise it is turquoise in color.
- Small red or lime colored circles indicate tops and dips.
To find out what the various numbers mean and under what conditions they appear see the code.
Screenshots
Indicator / Formula
//||===================================================================================||
//|| K-Trend - V.1.0 -  by Karthikmarar                                                                                                                ||
//|| www.karthikmarar.blogspot.com                                                                                                                    ||
//|| Public release for personal use only.                                                                                                            ||
//|| Please do not commercialize this indicator in its original or modified form                                                    ||
//||===================================================================================||

_SECTION_BEGIN("KTrend");
SetChartOptions(0,chartShowArrows|chartShowDates);
_N(Title = StrFormat("{{NAME}} - {{INTERVAL}} {{DATE}} Open %g, Hi %g, Lo %g, Close %g (%.1f%%) {{VALUES}}", O, H, L, C, SelectedValue( ROC( C, 1 ) ) ));

T1 = Param("Momentum Period",5,0,100,1);
M1s=Param("1st MA Period short",13,0,30,1);
m1l=Param("1st MA Period long",40,0,100,1);
M2=Param("2nd MA Period",5,0,100,1);
UL= Param("Upper Limit",40,0,100,1);
LL= Param("Lower Limit",-40,-100,100,1);
Type = ParamList("MA Type", "EMA|AMA");
j= C-Ref(C,-T1);
// Ema based calculation
n=EMA(EMA(j,M1s),M2);
d=EMA(EMA( abs(j) ,M1s),M2);
KT1=100*n/d;
kt1s=EMA(kt1,6);
//Ama based calculation
fast = 2/(2+1);
slow = 2/(30+1);
dir=abs(Close-Ref(Close,-10));
vol=Sum(abs(Close-Ref(Close,-1)),10);
ER=dir/vol;
sc =( ER*(fast-slow)+slow)^2;
q1= AMA(j,sc);
q2=AMA(abs(j),sc);
kt2= 100*(EMA(q1,m2)/EMA(q2,m2));
kt2s=EMA(kt2,6);
GraphXSpace=20;
// MA  Selection
kt=IIf(Type=="EMA",kt1,kt2);
kts=IIf(Type=="EMA",kt1s,kt2s);
ktcolor=IIf(KT<-80,colorDarkRed,IIf(KT<-60,colorRed,IIf(KT<-40,colorLightOrange,IIf(KT<0,colorPink,
IIf(KT<40,colorLightBlue,IIf(KT<60,colorPaleGreen,IIf(KT<80,colorLime,colorGreen)))))));
Plot( kt, "KTrend", ktcolor, styleHistogram | styleThick   );
Plot( kts, "Signal line.", IIf(kts>kt,colorOrange,colorTurquoise), 512  | styleThick   );
Plot( kts+1, "", IIf(kts>kt,colorOrange,colorTurquoise), 512  | styleThick   );
PlotGrid(UL,colorBlue);
PlotGrid(LL,colorBlue);
//Long term ribbon
nl=EMA(EMA(j,M1l),M2);
dl=EMA(EMA( abs(j) ,M1l),M2);
KTl=100*nl/dl;
KTl_color=IIf(KTl<-80,colorDarkRed,IIf(KTl<-60,colorRed,IIf(KTl<-40,colorLightOrange,IIf(KTl<0,colorPink,IIf(KTl<40,colorLightBlue,IIf(KTl<60,colorPaleGreen,IIf(KTl<80,colorLime,colorGreen)))))));
Plot( 5,"Ribbon",KTl_color,styleOwnScale|styleArea|styleNoLabel, -0.5,100 );
_SECTION_END();
//------------------------------------------------------------------------------------------
//                     Analysis
//---------------------------------------------------------------------------------------
_SECTION_BEGIN("RAVI");
P1 = Param("Short Period",7,0,100,1);
P2 = Param("Long Period",65,0,100,1);
L1=Param("Threshold",4,2,10,1);
U= MA(C,P1)-MA(C,P2);
R=100*U/MA(C,P2);
// check if RAVI is moving up
Rup=R >Ref(R,-1) AND Ref(R,-1)>Ref(R,-2);
_SECTION_END();
//---------------------------------------------------------------------------------------------
_SECTION_BEGIN("LR Slope");
RPDS=ParamList("R2 Period", "5|10|14|20|25|30|50|60|120" );
R2PDS=IIf(rpds=="5",5,IIf(rpds=="10",10,IIf(rpds=="14",14,IIf(rpds=="20",20,IIf(rpds=="25",25,IIf(rpds=="30",30,IIf(rpds=="50",50,IIf(rpds=="60",60,120))))))));
R2=Correlation(Cum( 1 ),C,r2pds)*Correlation(Cum( 1 ),C,r2pds);
Sp=LinRegSlope(C,r2pds);
rsp=IIf(sp>=Ref(sp,-1) AND Ref(sp,-1)>=Ref(sp,-2),1,0);
fsp=IIf(sp<=Ref(sp,-1) AND Ref(sp,-1)<=Ref(sp,-2),1,0);
Crit=IIf(R2PDS==5,.77,IIf(R2PDS==10,.40,IIf(R2PDS==14,.27,IIf(R2PDS==20,.20,IIf(R2PDS==25,.16,IIf(R2PDS==30,.13,IIf(R2PDS==50,.08,IIf(R2PDS==60,.06,IIf(R2PDS==120,.03,0)))))))));
r2color=IIf(r2>Crit,colorLime,colorRed);
_SECTION_END();
//--------------------------------------------------------------------------
_SECTION_BEGIN("Analysis");
//Tops & Dips
Tp = Ref(KT,-1) == HHV(KT,3);
TpL = Tp AND Ref(KT,-1) >  UL;
Vl = Ref(KT,-1)==LLV(KT,3);
Vly=Ref(KT,-2)==LLV(KT,4);
VlL = Vl AND Ref(KT,-1) < LL;
PlotShapes(IIf(tp ,shapeSmallCircle+ shapePositionAbove,shapeNone),colorRed,kt,0,0);
PlotShapes(IIf(Vl ,shapeSmallCircle+ shapePositionAbove,shapeNone),colorLime,0,0,0);
//-----------------Zeroline Loop - Long - zll----------------------------------
zll= Vly AND Ref(kt,-1)<0 AND Ref(kt,-1)>(-40) AND sp>Ref(sp,-1)AND HHV(KT,8)>30;
PlotShapes(IIf(zll,shapeDigit1 ,Null),colorPaleGreen,0,Min(0,kt)+30,Min(0,kt)-45);
PlotShapes(IIf(zll,shapeUpArrow,Null),colorGreen,0,Min(0,kt),-10);
//------------------Zeroline Bounce - Long - zbl--------------------------------
zbl= Vly AND Ref(kt,-1)<20 AND Ref(kt,-1)>0 AND r>L1 AND HHV(KT,8)>30 ;
PlotShapes(IIf(zbl,shapeDigit2 ,Null),colorPaleGreen,0,Min(0,kt)+20,Min(0,kt)-45);
PlotShapes(IIf(zbl,shapeUpArrow,Null),colorGreen,0,Min(0,kt),-10);
//------------------Pullback Entry Strong-pbes----------------------------------
pbes= Vl AND Ref(kt,-1)>20 AND Ref(kt,-1)<40 AND R2>Crit AND rsp;
PlotShapes(IIf(pbes,shapeDigit3 ,Null),colorPaleGreen,0,Min(0,kt)+20,Min(0,kt)-45);
PlotShapes(IIf(pbes,shapeUpArrow,Null),colorGreen,0,Min(0,kt),-10);
//------------------Pullback Entry Strong-pbel----------------------------------
pbel= Vly AND Ref(kt,-1)>40  AND R2>Crit AND sp>Ref(sp,-1) ;
PlotShapes(IIf(pbel,shapeDigit4 ,Null),colorPaleGreen,0,Min(0,kt)+20,Min(0,kt)-45);
PlotShapes(IIf(pbel,shapeUpArrow,Null),colorGreen,0,Min(0,kt),-10);
//-------------------Zeroline Loop - short - zls---------------------------------
zls= tp AND Ref(kt,-1)>0 AND Ref(kt,-1)<(40) AND R2>Crit ;
PlotShapes(IIf(zls,shapeDigit1 ,Null),colorPink ,0,Max(0,kt)+20,Max(0,kt)+15);
PlotShapes(IIf(zls,shapeDownArrow,Null),colorRed,0,Max(0,kt),-10);
//---------------------- Zeroline Bounce - Short - zbs--------------------------------
zbs= tp AND Ref(kt,-1)<0 AND Ref(kt,-1)>(-20) AND R2>Crit ;
PlotShapes(IIf(zbs,shapeDigit2 ,Null),colorPink ,0,Max(0,kt)+20,Max(0,kt)+15);
PlotShapes(IIf(zbs,shapeDownArrow,Null),colorRed,0,Max(0,kt),-10);
//------------------------Pullup shorthing oppurtunity -pso----------------------
pso= tp AND Ref(kt,-1)>(-40) AND Ref(kt,-1)<(-20) AND R2>Crit ;
PlotShapes(IIf(pso,shapeDigit3 ,Null),colorPink ,0,Max(0,kt)+20,Max(0,kt)+15);
PlotShapes(IIf(pso,shapeDownArrow,Null),colorRed,0,Max(0,kt),-10);
//----------------------Additioal shorting oppurtunity--------------------------
aso= tp AND Ref(kt,-1)<(-40) AND R2>Crit ;
PlotShapes(IIf(aso,shapeDigit4 ,Null),colorPink ,0,Max(0,kt)+20,Max(0,kt)+15);
PlotShapes(IIf(aso,shapeDownArrow,Null),colorRed,0,Max(0,kt),-10);
//-------------------------------------------------------------------------------
_SECTION_END();

Title = EncodeColor(colorYellow)+"K-Trend- V.1.0" + " - " +  Name() + " - " + EncodeColor(colorRed)+ Interval(2) + EncodeColor() + "  - " + Date() +" - " +
EncodeColor(colorLime)+ "K-Trend= "+WriteVal(kt)+"--"+EncodeColor(colorYellow)+WriteIf (tp AND kt>0, " A top seen, May pullback",
WriteIf(Vl AND kt<0,"A Bottom Seen May Pullup",""))+EncodeColor(colorPink)+WriteIf(zll,"Early Entry",WriteIf(zbl,"Zeroline Bounce Long",
WriteIf(pbes,"Pullback Buy Oppurtunity-Strong", WriteIf(pbel,"Pullback Buy Oppurtunity-Light",WriteIf(zls,"Zeroline Loop Short",
WriteIf(zbs,"zeroline Bounce Short",WriteIf(pso,"Shorting Oppurtunity",WriteIf(aso,"Addl. Shorting Oppurtunity"," "))))))));
3 comments
Leave Comment
Please login here to leave a comment.
Very good. Keep it up. True signal
Thanks its a good afl.
woow good one