Highest High and Lowest Low For User Set Period of Time for Amibroker (AFL)
joby Kumar over 8 years ago Amibroker (AFL)
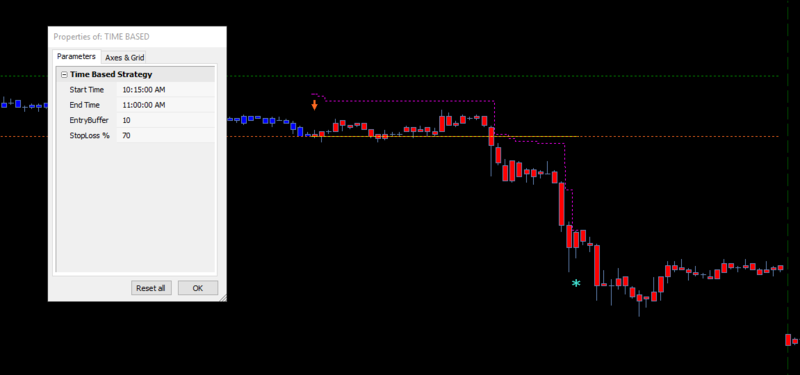
This formula allows you plot the highest high and lowest low for a particular period of time e.g. (high or low from 11:06 to 11:28). The formula will also trigger a buy or sell when the price crosses the high or low for the selected time period. I have also added a percentage trailing stop loss. Buy price, sell price, short and cover variables have also been set properly for algorithmic traders. There are also buffer points for the high and low variables. Please refer to the screen shot for more details.
Screenshots
Indicator / Formula
Copy & Paste Friendly
///Created By Viatrades
///Viatradess@gmail.com
SetBarsRequired( sbrAll, sbrAll );
SetPositionSize( 1, spsShares );

SetChartOptions( 0, chartShowArrows | chartShowDates );
_N( Title = StrFormat( "{{NAME}} - {{INTERVAL}} {{DATE}} Open %g, Hi %g, Lo %g, Close %g (%.1f%%) {{VALUES}}", O, H, L, C, SelectedValue( ROC( C, 1 ) ) ) );

DT = DateTime();
DN = DateNum();
TN = TimeNum();


function Asign( x )
{
    y = Null;

    for( i = 0; i < BarCount; i++ )
    {
        y[i] = x;
    }

    return y;
}


StartTime = OST = ParamTime( "Start Time", "10:15:00 AM" );
EndTime = OET = ParamTime( "End Time", "11:00:00 AM" );

EntryBuffer = Param( "EntryBuffer", 10, 0, 1000, 0.01 );
StopLossBuffer = Param( "StopLoss %", 70, 0, 200, 1 );
ActiveBand = TN > EndTime;
InactiveBand = TN <= EndTime;

DaysEnd = Cross( TimeNum(), OET );
DaysStart =  Cross( TimeNum(), OST );

Highest_since = HighestSince( DaysStart, H, 1 );
Lowest_since  = LowestSince( DaysStart, L, 1 );

BuyTrigger = ValueWhen( DaysEnd , Highest_since, 1 ) + EntryBuffer;
ShortTrigger = ValueWhen( DaysEnd, Lowest_since, 1 ) - EntryBuffer;

SLTGVal = ( ( BuyTrigger - ShortTrigger ) * StopLossBuffer ) / 100;


Buy = High > BuyTrigger && ActiveBand ;
Short = ShortTrigger > Low && ActiveBand ;

Sell = ShortTrigger >  Low || DaysEnd;
Cover = High > BuyTrigger || DaysEnd;

Buy = ExRem( Buy, Sell );
Sell = ExRem( Sell, Buy );

Short = ExRem( Short, Cover );
Cover = ExRem( Cover, Short );


BuyPrice = ValueWhen( Buy, BuyTrigger );
ShortPrice = ValueWhen( Short, ShortTrigger );

LSL = IIf( Buy, ( BuyPrice - SLTGVal ), ( Ref( HighestSince( Buy, High ), -1 ) - SLTGVal ) );
SSL = IIf( Short, ( ShortPrice + SLTGVal ), ( Ref( LowestSince( Short, Low ), -1 ) + SLTGVal ) );

Sell = Sell || Low < LSL;
Cover = Cover || High > SSL;

Buy = ExRem( Buy, Sell );
Sell = ExRem( Sell, Buy );

Short = ExRem( Short, Cover );
Cover = ExRem( Cover, Short );

BuyPlot = Flip( Buy, Sell ) || Sell;
ShortPlot = Flip( Short, Cover ) || Cover;

Plot( IIf( ActiveBand, BuyTrigger, Null ), "Buy Trigger", colorGreen, styleDashed );
Plot( IIf( ActiveBand, ShortTrigger, Null ), "Short Trigger", colorOrange, styleDashed );

Plot( IIf( BuyPlot, BuyPrice, Null ), "BuyPrice", colorYellow, styleDashed | styleStaircase, Null, Null, 0, 1, 1 );
Plot( IIf( ShortPlot, ShortPrice, Null ), "ShortPrice", colorYellow, styleDashed | styleStaircase, Null, Null, 0, 1, 1 );

Plot( IIf( BuyPlot, LSL, Null ), "LongSL", colorCustom12, styleDashed | styleStaircase, Null, Null, 0, 1, 1 );
Plot( IIf( ShortPlot, SSL, Null ), "ShortSL", colorCustom12, styleDashed | styleStaircase, Null, Null, 0, 1, 1 );

PlotShapes( IIf( Buy, shapeUpArrow, shapeNone ), colorBrightGreen, 0, Low, -15, 0 );
PlotShapes( IIf( Sell, shapeStar, shapeNone ), colorRed, 0, High, -15, 0 );

PlotShapes( IIf( Short, shapeDownArrow, shapeNone ), colorOrange, 0, High, -35, 0 );
PlotShapes( IIf( Cover, shapeStar, shapeNone ), colorTurquoise, 0, Low, -35, 0 );


Candlecol = IIf( BarsSince( Buy ) < BarsSince( Short ) AND BarsSince( Buy ) != 0, colorBlue,
                 IIf( BarsSince( Buy ) > BarsSince( Short ) AND BarsSince( Short ) != 0, 4, 1 ) );
cc1 = IIf( Buy, colorBlue, IIf( Short, colorRed, Candlecol ) );
SetBarFillColor( Cc1 );

Plot( C, "Price", colorDefault, styleCandle );
6 comments
Leave Comment
Please login here to leave a comment.
Thanks Joby Bro………
but getting error with
Ln:93 Col:78
Error 16
Too many arguments
if possible add sound and pop out
my name is atin shah having many afls but need some modifications kindly contact me on 9662099456 or mail on atinshah@gmail.com *
future looking code
Thanks for this code, was looking for this from long time
9:45 to 10AM – 15m candle breakout works so perfectly – 90% accuracy on all stocks, some give reversal trades at 1:30 too
This is a good AFL.
I would like to have only High and Low Plotted between 13:50 and 18:40
How to do it.
I dont want any signals