Modified Triple Momentum Strategy for Amibroker (AFL)
jerrytran over 8 years ago Amibroker (AFL)
Triple Momentum Strategy is from Gerald Appel, introduced in his 2005 book, “Technical Analysis: Power Tools for Active Investors.” It’s included on pages 58-63 of his book. That section is headed, “The Triple Momentum Nasdaq Index Trading Model.” Gerald Appel, is also probably best known for his creation – Moving Average Convergence Divergence (MACD).
Mr. Appel’s Says, “There is only one buy rule and only one sell rule: You buy when the Triple Momentum Level, the sum of the 5-, 15-, and 25-day rates of change, crosses from below to above 4%. You sell when the Triple Momentum Level, the sum of the 5-, 15-, and 25-day rates of change, crosses from above to below 4%.“
Here is a slightly modified Triple Momentum Strategy which works good with Equities and Commodities for Positional Trading and one can consider this as a low risk strategy.
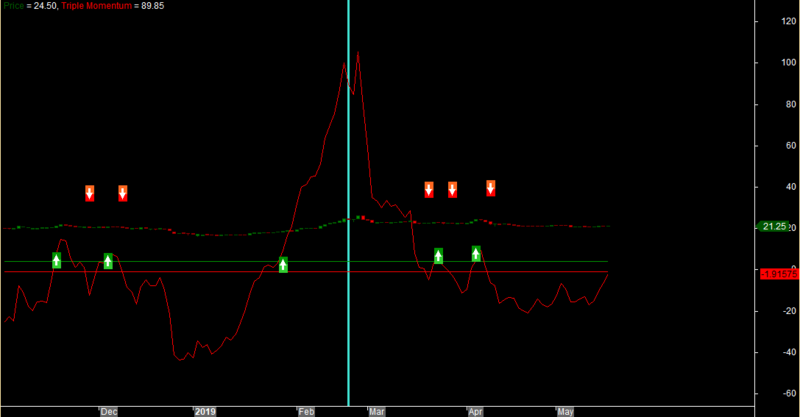
Screenshots
Indicator / Formula
_SECTION_BEGIN("Appel's ROC");

SetBarsRequired(100000,0);

GraphXSpace = 15;

SetChartOptions(0,chartShowArrows|chartShowDates);

SetChartBkColor(ParamColor("bkcolor",ColorRGB(0,0, 0)));

GfxSetBkMode(0);

GfxSetOverlayMode(1);

SetBarFillColor(IIf(C>O,ParamColor("Candle UP Color", colorGreen),IIf(C<=O,ParamColor("Candle Down Color", colorRed),colorLightGrey)));

Plot(C,"\nPrice",IIf(C>O,ParamColor("Wick UP Color", colorDarkGreen),IIf(C<=O,ParamColor("Wick Down Color", colorDarkRed),colorLightGrey)),64,0,0,0,0);

SetPositionSize(2,spsShares);

x = ROC (C, 5);
y = ROC (C, 15);
z = ROC (C, 25);

A = x + y + z;

Buy = Cross (A,4);
Sell = Cross (-1,A);
Buy=ExRem(Buy,Sell);
Sell=ExRem(Sell,Buy);
Filter = Buy OR Sell;

AddColumn( Buy, "Buy", 1);
AddColumn(Sell, "Sell", 1);
AddColumn(Close,"Close",1.2);
AddColumn(Volume,"Volume",1.0);

PlotShapes(IIf(Buy, shapeSquare, shapeNone),colorGreen, 0, L, Offset=-40);

PlotShapes(IIf(Buy, shapeSquare, shapeNone),colorLime, 0,L, Offset=-50);

PlotShapes(IIf(Buy, shapeUpArrow, shapeNone),colorWhite, 0,L, Offset=-45);

PlotShapes(IIf(Sell, shapeSquare, shapeNone),colorRed, 0, H, Offset=40);

PlotShapes(IIf(Sell, shapeSquare, shapeNone),colorOrange, 0,H, Offset=50);

PlotShapes(IIf(Sell, shapeDownArrow, shapeNone),colorWhite, 0,H, Offset=-45);

_SECTION_END();

_SECTION_BEGIN("Triple Momentum Indicator");

SetBarsRequired(100000,0);

GraphXSpace = 15;

SetChartOptions(0,chartShowArrows|chartShowDates);

SetChartBkColor(ParamColor("bkcolor",ColorRGB(0,0, 0)));

GfxSetBkMode(0);

GfxSetOverlayMode(1);

SetBarFillColor(IIf(C>O,ParamColor("Candle UP Color", colorGreen),IIf(C<=O,ParamColor("Candle Down Color", colorRed),colorLightGrey)));

//Plot(C,"\nPrice",IIf(C>O,ParamColor("Wick UP Color", colorDarkGreen),IIf(C<=O,ParamColor("Wick Down Color", colorDarkRed),colorLightGrey)),64,0,0,0,0);


x = ROC (C, 5);
y = ROC (C, 15);
z = ROC (C, 25);

A = x + y + z;

Plot (A, "Triple Momentum", colorRed);

Plot (4, "", colorGreen, styleNoLabel, styleDashed);
Plot (-1, "", colorRed, styleNoLabel, styleDashed);

Buy = Cross (A,4);
Sell = Cross (4,A);
Filter = Buy OR Sell;

AddColumn( Buy, "Buy", 1);
AddColumn(Sell, "Sell", 1);
AddColumn(Close,"Close",1.2);
AddColumn(Volume,"Volume",1.0);

_SECTION_END();
0 comments
Leave Comment
Please login here to leave a comment.