Supply and Demand Zone for Amibroker (AFL)
doanthedung over 8 years ago Amibroker (AFL)
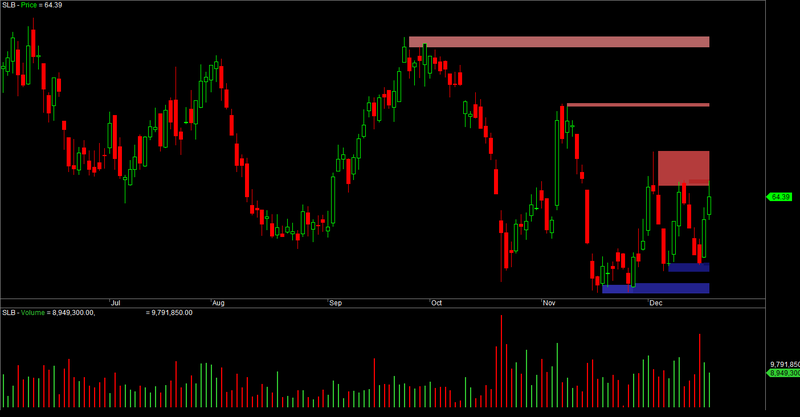
This indicator can find the Supply and Demand zone to make decide entry or exit positions. Work fine with weekly & monthly chart.
A supply zone on a chart is an area where selling interest outnumbers buying interest and the price falls until the buying-selling balance is restored. Similarly, a demand zone is a price level where price rallies because there is much more buying interest than selling interest.
Supply and demand zones can be used as additional entry information, but many traders use them to determine potential targets and exits on their trades. Once you start paying attention to supply and demand zones, you will see that they often act as price magnets where the price often gravitates towards.
Have a good trade!
Screenshots
Indicator / Formula
_SECTION_BEGIN("Supply and Demand Zone");
SetChartOptions(0,chartShowArrows|chartShowDates);
_N(Title = StrFormat("{{NAME}} - {{INTERVAL}} {{DATE}} Open %g, Hi %g, Lo %g, Close %g (%.1f%%) {{VALUES}}", O, H, L, C, SelectedValue( ROC( C, 1 ) ) ));
Plot( C, "Close", ParamColor("Color", colorDefault ), styleNoTitle | ParamStyle("Style") | GetPriceStyle() );

g = Param( "No.of Lines", 7, 1, 7, 1 );
x = Cum( 1 );

pk = BarsSince( H >= Ref( H, -1 ) AND H >= Ref( H, -2 ) AND H >= Ref( H, -3 ) AND H >= Ref( H, -4 ) AND H >= Ref( H, 1 ) AND H >= Ref( H, 2 ) AND H >= Ref( H, 3 ) AND H >= Ref( H, 4 ) ) == 0;
tk = BarsSince( L <= Ref( L, -1 ) AND L <= Ref( L, -2 ) AND L <= Ref( L, -3 ) AND L <= Ref( L, -4 ) AND L <= Ref( L, 1 ) AND L <= Ref( L, 2 ) AND L <= Ref( L, 3 ) AND L <= Ref( L, 4 ) ) == 0;

px1 = LastValue( ValueWhen( pk, x, 1 ) );
px2 = LastValue( ValueWhen( Pk, x, 2 ) );
px3 = LastValue( ValueWhen( Pk, x, 3 ) );
px4 = LastValue( ValueWhen( pk, x, 4 ) );
px5 = LastValue( ValueWhen( Pk, x, 5 ) );
px6 = LastValue( ValueWhen( Pk, x, 6 ) );
px7 = LastValue( ValueWhen( Pk, x, 7 ) );

tx1 = LastValue( ValueWhen( Tk, x, 1 ) );
tx2 = LastValue( ValueWhen( Tk, x, 2 ) );
tx3 = LastValue( ValueWhen( Tk, x, 3 ) );
tx4 = LastValue( ValueWhen( Tk, x, 4 ) );
tx5 = LastValue( ValueWhen( Tk, x, 5 ) );
tx6 = LastValue( ValueWhen( Tk, x, 6 ) );
tx7 = LastValue( ValueWhen( Tk, x, 7 ) );

XT1 = LastValue( ValueWhen( pk, H, 1 ) );
XT1c = LastValue( ValueWhen( pk, Max( C, O ), 1 ) );
XT2 = LastValue( ValueWhen( Pk, H, 2 ) );
XT2c = LastValue( ValueWhen( pk, Max( C, O ), 2 ) );
XT3 = LastValue( ValueWhen( Pk, H, 3 ) );
XT3c = LastValue( ValueWhen( pk, Max( C, O ), 3 ) );
XT4 = LastValue( ValueWhen( pk, H, 4 ) );
XT4c = LastValue( ValueWhen( pk, Max( C, O ), 4 ) );
XT5 = LastValue( ValueWhen( Pk, H, 5 ) );
XT5c = LastValue( ValueWhen( pk, Max( C, O ), 5 ) );
XT6 = LastValue( ValueWhen( Pk, H, 6 ) );
XT6c = LastValue( ValueWhen( pk, Max( C, O ), 6 ) );
XT7 = LastValue( ValueWhen( Pk, H, 7 ) );
XT7c = LastValue( ValueWhen( pk, Max( C, O ), 7 ) );

YT1 = LastValue( ValueWhen( tk, L, 1 ) );
YT1c = LastValue( ValueWhen( tk, Min( O, C ), 1 ) );
YT2 = LastValue( ValueWhen( tk, L, 2 ) );
YT2c = LastValue( ValueWhen( tk, Min( O, C ), 2 ) );
YT3 = LastValue( ValueWhen( tk, L, 3 ) );
YT3c = LastValue( ValueWhen( tk, Min( O, C ), 3 ) );
YT4 = LastValue( ValueWhen( tk, L, 4 ) );
YT4c = LastValue( ValueWhen( tk, Min( O, C ), 4 ) );
YT5 = LastValue( ValueWhen( tk, L, 5 ) );
YT5c = LastValue( ValueWhen( tk, Min( O, C ), 5 ) );
YT6 = LastValue( ValueWhen( tk, L, 6 ) );
YT6c = LastValue( ValueWhen( tk, Min( O, C ), 6 ) );
YT7 = LastValue( ValueWhen( tk, L, 7 ) );
YT7c = LastValue( ValueWhen( tk, Min( O, C ), 7 ) );

pk1 = IIf( x > px1 AND HHV( H, x - px1 )<XT1 AND g >= 1, XT1, Null );
pk1c = IIf( x > px1 AND HHV( H, x - px1 )<XT1 AND g >= 1, XT1c, Null );

for( i = BarCount - 1; i > px1; i-- )
{
    if( H[i] > pk1[px1] )
    {
        pk1 = pk1c = Null;
    }
}

Col1 = IIf( LastValue( C ) > pk1, ColorRGB( 14, 14, 100 ), ColorRGB( 180, 20, 20 ) );
PlotOHLC( 0, pk1, pk1c, 0, "", Col1, styleCloud | styleNoLabel, Null, Null, Null, -1 );

pk2 = IIf( x > px2 AND HHV( H, x - px2 )<XT2 AND g >= 2, XT2, Null );
pk2c = IIf( x > px2 AND HHV( H, x - px2 )<XT2 AND g >= 2, XT2c, Null );

for( i = BarCount - 1; i > px2; i-- )
{
    if( H[i] > pk2[px2] )
    {
        pk2 = pk2c = Null;
    }
}

Col2 = IIf( LastValue( C ) > pk2, ColorRGB( 24, 24, 120 ), ColorRGB( 180, 40, 40 ) );
PlotOHLC( 0, pk2, pk2c, 0, "", Col2, styleCloud | styleNoLabel, Null, Null, Null, -2 );

pk3 = IIf( x > px3 AND HHV( H, x - px3 )<XT3 AND g >= 3, XT3, Null );
pk3c = IIf( x > px3 AND HHV( H, x - px3 )<XT3 AND g >= 3, XT3c, Null );

for( i = BarCount - 1; i > px3; i-- )
{
    if( H[i] > pk3[px3] )
    {
        pk3 = pk3c = Null;
    }
}

Col3 = IIf( LastValue( C ) > pk3, ColorRGB( 34, 34, 140 ), ColorRGB( 180, 60, 60 ) );
PlotOHLC( 0, pk3, pk3c, 0, "", Col3, styleCloud | styleNoLabel, Null, Null, Null, -3 );

pk4 = IIf( x > px4 AND HHV( H, x - px4 )<XT4 AND g >= 4, XT4, Null );
pk4c = IIf( x > px4 AND HHV( H, x - px4 )<XT4 AND g >= 4, XT4c, Null );

for( i = BarCount - 1; i > px4; i-- )
{
    if( H[i] > pk4[px4] )
    {
        pk4 = pk4c = Null;
    }
}

Col4 = IIf( LastValue( C ) > pk4, ColorRGB( 44, 44, 160 ), ColorRGB( 180, 80, 80 ) );
PlotOHLC( 0, pk4, pk4c, 0, "", Col4, styleCloud | styleNoLabel, Null, Null, Null, -4 );

pk5 = IIf( x > px5 AND HHV( H, x - px5 )<XT5 AND g >= 5, XT5, Null );
pk5c = IIf( x > px5 AND HHV( H, x - px5 )<XT5 AND g >= 5, XT5c, Null );

for( i = BarCount - 1; i > px5; i-- )
{
    if( H[i] > pk5[px5] )
    {
        pk5 = pk5c = Null;
    }
}

Col5 = IIf( LastValue( C ) > pk5, ColorRGB( 54, 54, 180 ), ColorRGB( 180, 100, 100 ) );
PlotOHLC( 0, pk5, pk5c, 0, "", Col5, styleCloud | styleNoLabel, Null, Null, Null, -5 );

pk6 = IIf( x > px6 AND HHV( H, x - px6 )<XT6 AND g >= 6, XT6, Null );
pk6c = IIf( x > px6 AND HHV( H, x - px6 )<XT6 AND g >= 6, XT6c, Null );

for( i = BarCount - 1; i > px6; i-- )
{
    if( H[i] > pk6[px6] )
    {
        pk6 = pk6c = Null;
    }
}

Col6 = IIf( LastValue( C ) > pk6, ColorRGB( 64, 64, 200 ), ColorRGB( 180, 120, 120 ) );
PlotOHLC( 0, pk6, pk6c, 0, "", Col6, styleCloud | styleNoLabel, Null, Null, Null, -6 );

pk7 = IIf( x > px7 AND HHV( H, x - px7 )<XT7 AND g >= 7, XT7, Null );
pk7c = IIf( x > px7 AND HHV( H, x - px7 )<XT7 AND g >= 7, XT7c, Null );

for( i = BarCount - 1; i > px7; i-- )
{
    if( H[i] > pk7[px7] )
    {
        pk7 = pk7c = Null;
    }
}

Col7 = IIf( LastValue( C ) > pk7, ColorRGB( 74, 74, 220 ), ColorRGB( 180, 140, 140 ) );
PlotOHLC( 0, pk7, pk7c, 0, "", Col7, styleCloud | styleNoLabel, Null, Null, Null, -7 );

tl1 = IIf( x > tx1 AND LLV( L, x - tx1 ) > YT1 AND g >= 1, YT1, Null );
tl1c = IIf( x > tx1 AND LLV( L, x - tx1 ) > YT1 AND g >= 1, YT1c, Null );

for( i = BarCount - 1; i > tx1; i-- )
{
    if( L[i] < tl1[tx1] )
    {
        tl1 = tl1c = Null;
    }
}

Col1 = IIf( LastValue( C ) > tl1, ColorRGB( 14, 14, 100 ), ColorRGB( 180, 20, 20 ) );
PlotOHLC( 0, tl1, tl1c, 0, "", Col1, styleCloud | styleNoLabel, Null, Null, Null, -1 );

tl2 = IIf( x > tx2 AND LLV( L, x - tx2 ) > YT2 AND g >= 2, YT2, Null );
tl2c = IIf( x > tx2 AND LLV( L, x - tx2 ) > YT2 AND g >= 2, YT2c, Null );

for( i = BarCount - 1; i > tx2; i-- )
{
    if( L[i] < tl2[tx2] )
    {
        tl2 = tl2c = Null;
    }
}

Col2 = IIf( LastValue( C ) > YT2, ColorRGB( 24, 24, 120 ), ColorRGB( 180, 40, 40 ) );
PlotOHLC( 0, tl2, tl2c, 0, "", Col2, styleCloud | styleNoLabel, Null, Null, Null, -2 );

tl3 = IIf( x > tx3 AND LLV( L, x - tx3 ) > YT3 AND g >= 3, YT3, Null );
tl3c = IIf( x > tx3 AND LLV( L, x - tx3 ) > YT3 AND g >= 3, YT3c, Null );

for( i = BarCount - 1; i > tx3; i-- )
{
    if( L[i] < tl3[tx3] )
    {
        tl3 = tl3c = Null;
    }
}

Col3 = IIf( LastValue( C ) > YT3, ColorRGB( 34, 34, 140 ), ColorRGB( 180, 60, 60 ) );
PlotOHLC( 0, tl3, tl3c, 0, "", Col3, styleCloud | styleNoLabel, Null, Null, Null, -3 );

tl4 = IIf( x > tx4 AND LLV( L, x - tx4 ) > YT4 AND g >= 4, YT4, Null );
tl4c = IIf( x > tx4 AND LLV( L, x - tx4 ) > YT4 AND g >= 4, YT4c, Null );

for( i = BarCount - 1; i > tx4; i-- )
{
    if( L[i] < tl4[tx4] )
    {
        tl4 = tl4c = Null;
    }
}

Col4 = IIf( LastValue( C ) > YT4, ColorRGB( 44, 44, 160 ), ColorRGB( 180, 80, 80 ) );
PlotOHLC( 0, tl4, tl4c, 0, "", Col4, styleCloud | styleNoLabel, Null, Null, Null, -4 );

tl5 = IIf( x > tx5 AND LLV( L, x - tx5 ) > YT5 AND g >= 5, YT5, Null );
tl5c = IIf( x > tx5 AND LLV( L, x - tx5 ) > YT5 AND g >= 5, YT5c, Null );

for( i = BarCount - 1; i > tx5; i-- )
{
    if( L[i] < tl5[tx5] )
    {
        tl5 = tl5c = Null;
    }
}

Col5 = IIf( LastValue( C ) > YT5, ColorRGB( 54, 54, 180 ), ColorRGB( 180, 100, 100 ) );
PlotOHLC( 0, tl5, tl5c, 0, "", Col5, styleCloud | styleNoLabel, Null, Null, Null, -5 );

tl6 = IIf( x > tx6 AND LLV( L, x - tx6 ) > YT6 AND g >= 6, YT6, Null );
tl6c = IIf( x > tx6 AND LLV( L, x - tx6 ) > YT6 AND g >= 6, YT6c, Null );

for( i = BarCount - 1; i > tx6; i-- )
{
    if( L[i] < tl6[tx6] )
    {
        tl6 = tl6c = Null;
    }
}

Col6 = IIf( LastValue( C ) > YT6, ColorRGB( 64, 64, 200 ), ColorRGB( 180, 120, 120 ) );
PlotOHLC( 0, tl6, tl6c, 0, "", Col6, styleCloud | styleNoLabel, Null, Null, Null, -6 );

tl7 = IIf( x > tx7 AND LLV( L, x - tx7 ) > YT7 AND g >= 7, YT7, Null );
tl7c = IIf( x > tx7 AND LLV( L, x - tx7 ) > YT7 AND g >= 7, YT7c, Null );

for( i = BarCount - 1; i > tx7; i-- )
{
    if( L[i] < tl7[tx7] )
    {
        tl7 = tl7c = Null;
    }
}

Col7 = IIf( LastValue( C ) > YT7, ColorRGB( 74, 74, 220 ), ColorRGB( 180, 140, 140 ) );
PlotOHLC( 0, tl7, tl7c, 0, "", Col7, styleCloud | styleNoLabel, Null, Null, Null, -7 );

_SECTION_END();
21 comments
Leave Comment
Please login here to leave a comment.
@admin @doanthedung I’m using amibroker 6.0 and it shows nothing on the screen. can you please help me?
Please add Price chart in the above AFL will work
@sadai Nah mate. Not working.
have added the price chart still no sign of any zones but on the right hand side
axis have noticed that top to bottom it start with 0 all the way to -10
have found the solution after adding the price chart go to edit and cut the price begin section to the end section and then paste it right at the top and it works.
@mashraf thanks a ton mate, it worked. any idea if it works well for 5 min chart or not?
admin @mashraf @doanthedung @sadaican you please give me a brief explanation of how to use it? the above-mentioned steps were not enough. I would really appreciate your time and help.
hi, you have to look for up zones and down zones now if there is an up zone then you have to look for a signal from other indicators could be rsa or stoch() or macd or whatever you prefer.
what i look for is ABC now if C is any thing above 0.38 to 0.889 then you are looking at an AB=CD so with bullish zone and C you have a chance to go long and make some money and the stop loss should be just below the zone.
please do your own research every one has their own system to their own needs.
hope this helps am still learning.
happy trading.
@mashraf thanks, pal. really appreciate your time.
Hi Mashraf,
AFL not working. Please assit
Regards,
Rajesh
hi i have a version of amibroker 5.10 ..and this indicator is not working on it …can somebody please help…please
That version of Amibroker is fairly old. It may be worth upgrading. What errors are you getting?
ok sir ill upgrade it …thxxx
hi mashraf is there any way to explore some ticker that on the demand area ,that’ll much help saving screening time thx , this afl good
hi ybhart look for Ed Potash,s afl for ABCD ,can not post without his permission.
Sir, what is the basic theory/logic of deriving supply/demand zone ?
Thanks.
thank you sir mashraf
good work , thanx
Hi can you give me the explorer of this alf…thx
Can you please help me with an EXPLORER code for the same – for the 1st instance, a new S / R zone is identified?
Thanks in advance…
Can you please help me with an EXPLORER code for the same – for the 1st instance, a new S / R zone is identified?
Thanks in advance…