Wilder's Moving Average with Swing Trend Indicator for Amibroker (AFL)
giripra over 8 years ago Amibroker (AFL)
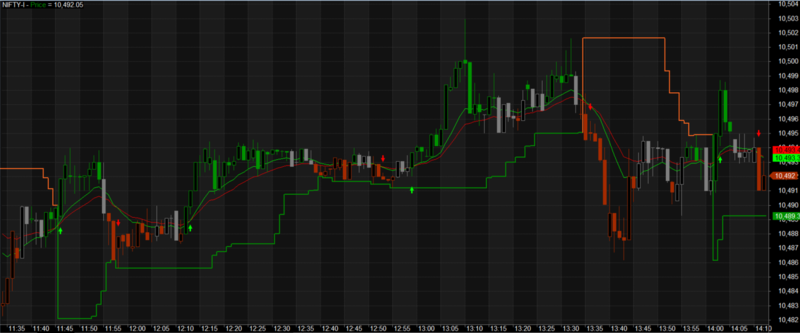
This indicator gives Buy/Sell signal as per the Wilder’s moving average crossover.
Buy when Wilders gives a Buy signal & Swing Trend is Up. SL = Swing Support
Sell when Wilders givens a Sell signal & Swing Trend is Down. SL = Swing Resistance
Screenshots
Indicator / Formula
Copy & Paste Friendly
_SECTION_BEGIN("CandleColor");
tgt = 35;
a = CCI(20) < -tgt;
b = CCI(20) > tgt;
state = IIf(a>b,-1,IIf(a==b,0,1));
Color = IIf(state == 0, colorGrey50, IIf(state == 1, colorGreen, IIf(state == -1, colorBrown, 0)));

SetChartOptions( 0, chartShowDates | chartShowArrows );
PlotOHLC(O,H,L,C,"Price",Color,styleCandle);

_SECTION_END();

_SECTION_BEGIN("Wilders");

M1 = Wilders(Close,7.5);
M2 = Wilders(Close,11);

Plot(M1, "", colorBrightGreen,styleLine);
Plot(M2, "", colorRed,styleLine);

A = Cross(M1,M2);
B = Cross(M2,M1);

PlotShapes(IIf(A,shapeUpArrow,shapeNone),colorBrightGreen,0,L,Offset= -30);
PlotShapes(IIf(B,shapeDownArrow,shapeNone),colorRed,0,H,Offset = -30);
_SECTION_END();


_SECTION_BEGIN("Swing Trend");
no=20;
res=HHV(H,no);
sup=LLV(L,no);
avd=IIf(C>Ref(res,-1),1,IIf(C<Ref(sup,-1),-1,0));
avn=ValueWhen(avd!=0,avd,1);
supres=IIf(avn==1,sup,res);
supres_col=IIf(avn==1,colorGreen,colorOrange);
Plot(supres,"",supres_col,styleStaircase|styleThick);

_SECTION_END();
1 comments
Leave Comment
Please login here to leave a comment.
It is better Change parameters in lines 15 and 16 to bigger values such as 14 and 28 instead of 7 and 11