Market Shiksha-Trend Check for Amibroker (AFL)
Saurabh about 8 years ago Amibroker (AFL)
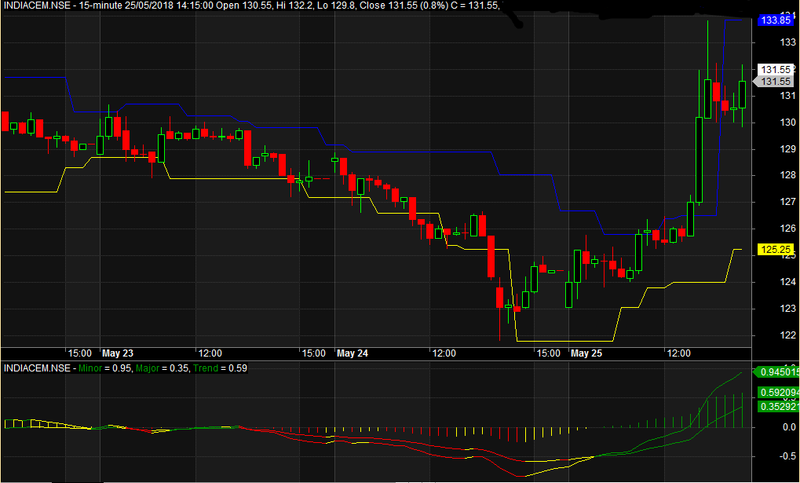
Trend catcher is a useful indicator for taking the trading decisions,, one can build many strategies using this as a base indicator. Combine this as a reference tool for Candlestick Patterns(not every pattern is successful,, check the trend first) or use it with Support & Resistances,, Gaps,, Fibonacci Retracements,, e.t.c,
For example:-
1). When Both the Lines r Green and above Zero & Histogram also turns Green, means Everything +ve,, go for Bear Hunting. Vice-versa for Bull Hunting. Use Support-Resistance lines for added confirmation.
2). Lines above zero means +ve bias and both below zero means -ve bias, Use pullbacks alongwith Candlestick reversals such as Hammers, Engulfings or Inside bars, e.t.c,,
Many more things to Explore, U can adjust the settings to suit ur requirement,, default is EMA. Remember nothing comes easy,, one definitely needs to put in some effort.
Hope the Indicator helps.
Criticism is Welcome.
Screenshots
Indicator / Formula
Standalone
_SECTION_BEGIN("Trend Check");

p= Param("shortperiods",15,2,300,1);

e1= EMA(C,p);

p2= Param("medperiods",25,2,300,1);

e2= EMA(C,p2);

p3= Param("longperiods",35,2,300,1);

e3= EMA(C,p3);

d1= e1-e2;

d2= e2-e3;

df= d1-d2;

Plot(d1,"Minor",IIf(d1>Ref(d1,-1) AND d1>d2,colorGreen,IIf(d1>Ref(d1,-1) AND d1<d2,colorYellow,IIf(d1<Ref(d1,-1) AND d1<d2,colorRed,IIf(d1<Ref(d1,-1) AND d1>d2,colorYellow,colorBlue)))),styleLine);
Plot(d2,"Major",IIf(d2>Ref(d2,-1) AND d1>d2,colorGreen,IIf(d2>Ref(d2,-1) AND d1<d2,colorYellow,IIf(d2<Ref(d2,-1) AND d1<d2,colorRed,IIf(d2<Ref(d2,-1) AND d1>d2,colorYellow,colorBlue)))),styleLine);
Plot(df,"Trend",IIf(df>Ref(df,-1) AND df>0,colorGreen,IIf(df>Ref(df,-1) AND df<0,colorYellow,IIf(df<Ref(df,-1) AND df<0,colorRed,colorYellow))),styleHistogram);

_SECTION_END();
4 comments
Leave Comment
Please login here to leave a comment.
nice afl
Looks promising, I will back test.
is it possible that you change the -1 to 1 and after doing that all the colors remains the same of the line.
Hi all AFL follower I post som modified AFL ple see_dev7718f@gmail.coh1. Your title here… Devesh