Intraday Reversal Breakout Order (RBO) Trading System for Amibroker (AFL)
georgiansanjay94 almost 8 years ago Amibroker (AFL)
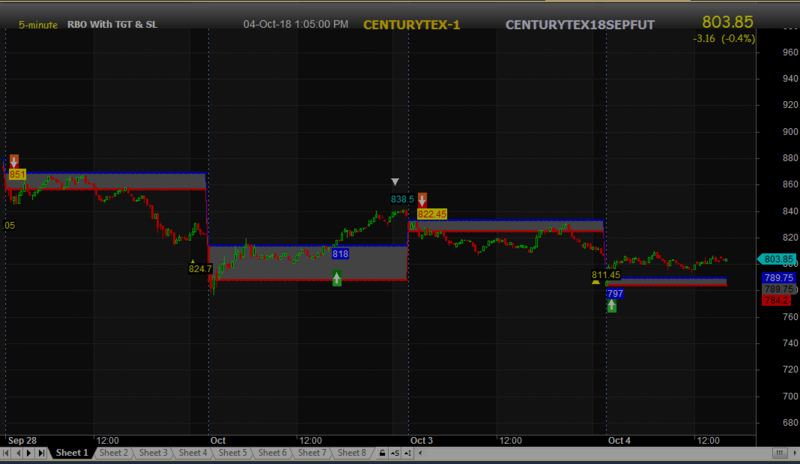
This is a 5 minute reversal breakout order (RBO) trading system indicator for intraday trading only.
I took the basic code from the net but have added many other parameters to make it more user friendly.
-you can change entry exit time
- Target and SL has been added
- Buffer zone is there for you to decide if you want to enter with some butter.
- Squares off your position at 3:05 Pm or you can choose your time of sq off.
Kindly let me know for any concerns you have.
- Only one word of caution – DO not apply in sideways stocks. Apply on high volatile scripts to get good results.
Regards,
SK
Screenshots
Indicator / Formula
Copy & Paste Friendly
SetTradeDelays( 1, 1, 1, 1 ); //set trade delays at 1 bar open
RoundLotSize = 40; // Define Round Lot Size of the Trading Instrument
SetPositionSize( 500, spsShares ); // Define Fixed Trading Size
SetOption( "InitialEquity", 200000 );
SetOption( "MinShares", 1 );
SetOption( "MinPosValue", 1 ); // Enable Futures Mode
SetOption( "FuturesMode", True );
SetOption( "AllowPositionShrinking", True );
SetOption( "ActivateStopsImmediately", False );
SetOption( "ReverseSignalForcesExit", False );
SetOption( "AllowSameBarExit", False );
SetOption( "CommissionMode", 2 ); // Fixed Brokerage Commissions (Per Trade)
SetOption( "CommissionAmount", 100 ); // Rs 100/Leg Commisions
SetOption( "InterestRate", 0 );
SetOption( "MarginRequirement", 2 ); //Define Margin Requirement
SetOption( "AccountMargin", 2 ); //Define Account Margin

function ParamOptimize( pname, defaultval, minv, maxv, step )
{
    return Optimize( pname,
                     Param( pname, defaultval, minv, maxv, step ),
                     minv, maxv, step );
}

_SECTION_BEGIN( "Price" );
SetChartOptions( 0, chartShowArrows | chartShowDates );
//_N(Title = StrFormat("{{NAME}} - {{INTERVAL}} {{DATE}} Open %g, Hi %g, Lo %g, Close %g (%.1f%%) {{VALUES}}", O, H, L, C, SelectedValue( ROC( C, 1 ) ) ));
Plot( C, "Close", colorCustom11, styleNoTitle | GetPriceStyle() );
_SECTION_END();

////////////////////////          DAY SEPERATOR              /////////////////////////////
//--Define all params
_SECTION_BEGIN( "RBO System Parameters" );
EntryBufferPct = ParamOptimize( "Entry Buffer %", 0, 0, 15, 0.1 );
SLPct = ParamOptimize( "SL %", 3, 0.25, 5, 0.25 );
TargetPct = ParamOptimize( "Target %", 5, 0, 100, 0.25 );
MaxTarget = 100;
TargetPct = IIf( TargetPct == 0, MaxTarget, TargetPct );
_SECTION_END();

_SECTION_BEGIN( "RBO System Signals & Time" );
n = 1; //ParamOptimize("Number of B/S to Generate in a Day",1,1,1,1);
ST = ParamOptimize( "Entry Start Time", 0915, 0915, 1445, 1 );
ET = ParamOptimize( "Entry End Time", 1430, 1010, 1530, 1 );
FTime = ParamOptimize( "Exit for the Day @", 1505, 1445, 1530, 1 );
tn = TimeNum();
TimeOK = tn >= ( ST * 100 ) AND tn <= ( ET * 100 );
FT = tn >= ( FTime * 100 );
_SECTION_END();

_SECTION_BEGIN( "RBO System" );
//--New Day & Time. End Day & Time . End Day & Time is null till end of day 1
NewDay = ( Day() != Ref( Day(), -1 ) ) OR BarIndex() == 0;
printf( "\n NewDay  : " + NewDay );
EndDay = ( Day() != Ref( Day(), 1 ) );
printf( "\n EndDay  : " + EndDay );
FirstBarTime = ValueWhen( NewDay, TimeNum(), 1 );
EndTime = ValueWhen( EndDay, TimeNum(), 1 );
SquareOffTime = EndTime;

Day1 = TimeFrameGetPrice( "O", inDaily );			// current day open

//Calculate ORB and Sl for 5Min RBO
HighestOfDay = HighestSince( NewDay, H, 1 );
LowestOfDay = LowestSince( NewDay, L, 1 );
ORBH = ValueWhen( NewDay, HighestOfDay , 1 ) * ( 1 + ( EntryBufferPct / 100 ) );
ORBL = ValueWhen( NewDay, LowestOfDay , 1 ) * ( 1 - ( EntryBufferPct / 100 ) );

//--Find Buy, Short, Sell & Cover Signals
BarsSinceNewDay = BarsSince( NewDay );
BuySignal = ( H >= ORBH );
printf( "\nBuySignal : " + BuySignal );
ShortSignal = ( L <= ORBL );
printf( "\nShortSignal  : " + ShortSignal );
BarsSinceLastBuySignal = ( BarsSince( Ref( BuySignal, -1 ) ) + 1 );
BarsSinceLastShortSignal = ( BarsSince( Ref( ShortSignal, -1 ) ) + 1 );
BarsSinceLastEntrySignal = Min( BarsSinceLastBuySignal, BarsSinceLastShortSignal );
BothEntrySignalsNull = IsNull( BarsSinceLastBuySignal ) AND IsNull( BarsSinceLastShortSignal ); //true for start of Day 1
Daych = Day() != Ref( Day(), -1 );

B1 = ( O >= ORBH ) AND( C >= ORBH ) AND TimeOK;
S1 = ( O <= ORBL ) AND( C <= ORBL ) AND TimeOK;

Buy = B1; // AND B2;
Short = S1;// AND S2;

Buy = Buy AND  Sum( Buy, BarsSince( newday ) + 1 ) <= N ;
Short = Short AND  Sum( Short, BarsSince( newday ) + 1 ) <= N ;

BuyPrice = IIf( Buy, Max( ORBH, O ), Null );
ShortPrice = IIf( Short, Min( ORBL, Open ), Null );

ORBHSL = ValueWhen( BuyPrice, BuyPrice ) * ( 1 - ( SLPct / 100 ) );
ORBLSL = ValueWhen( ShortPrice, ShortPrice ) * ( 1 + ( SLPct / 100 ) );
ORBHTarget = ValueWhen( BuyPrice, BuyPrice ) * ( 1 + ( TargetPct / 100 ) );
ORBLTarget = ValueWhen( ShortPrice, ShortPrice ) * ( 1 - ( TargetPct / 100 ) );

Sell = FT OR L <= ORBHSL OR H >= ORBHTarget OR( ( TimeNum() > SquareOffTime - 1 ) AND( BarsSinceNewDay > BarsSinceLastBuySignal ) );
Cover = FT OR H >= ORBLSL OR L <= ORBLTarget OR( ( TimeNum() > SquareOffTime - 1 )  AND( BarsSinceNewDay > BarsSinceLastShortSignal ) );

Buy = ExRem( Buy, Short OR daych OR Sell );
Short = ExRem( Short, Buy OR daych OR Cover );

SellPrice = IIf( Sell, IIf( H >= ORBHTarget, ORBHTarget, Max( ORBHSL, L ) ), Null );
CoverPrice = IIf( Cover, IIf( L <= ORBLTarget, ORBLTarget, Min( ORBLSL, H ) ), Null );

//--Handle if ORB broken both sides on same bar
//--And remove duplicate Short & Cover signals, since ExRem did not work as needed when Buy & Short on same bar
orbBothSides = IIf( Buy AND Short, 1, 0 );
Buy = IIf( orbBothSides AND C <= O, 0, Buy );
Short = IIf( orbBothSides AND C > O, 0, Short );
Sell = IIf( orbBothSides AND C > O AND( L <= ORBHSL ), 1, Sell );
Sell = IIf( ( BarsSince( Buy ) < ( BarsSince( Ref( Sell, -1 ) ) + 1 ) ) OR( BarsSince( Buy ) AND IsNull( BarsSince( Ref( Sell, -1 ) ) ) ), Sell, 0 );
Cover = IIf( orbBothSides AND C <= O AND( H >= ORBLSL ), 1, Cover );
Cover = IIf( ( BarsSince( Short ) < ( BarsSince( Ref( Cover, -1 ) ) + 1 ) ) OR( BarsSince( Short ) AND IsNull( BarsSince( Ref( Cover, -1 ) ) ) ), Cover, 0 );

dist = 3.5 * ATR( 10 );
dist1 = 2.5 * ATR( 10 );

for( i = 0; i < BarCount; i++ )
{
    if( Buy[i] )
    {
        PlotText( "" + C[ i ], i, C[ i ] - dist[i], colorWhite, colorBlue );
    }

    if( Short[i] )
    {
        PlotText( "" + C[ i ], i, C[ i ] + dist1[i], colorRed, colorYellow );
    }
}

dist = -2 * ATR( 10 );
dist1 = -5.5 * ATR( 10 );

for( i = 0; i < BarCount; i++ )
{
    if( Sell[i] )
    {
        PlotText( "" + C[ i ], i, C[ i ] - dist[i], colorCustom11, colorBlack );
    }

    if( Cover[i] )
    {
        PlotText( "" + C[ i ], i, C[ i ] + dist1[i], colorYellow, colorBlack );
    }
}

Plot( ORBH, "", colorBlue, styleDots );
Plot( ORBL, "", colorRed, styleDots );
PlotOHLC( ORBL, ORBH, ORBL, ORBH, "", colorGrey40, styleCloud );

/* Plot Buy and Short Signal Arrows */
PlotShapes( IIf( Buy, shapeSquare, shapeNone ), colorGreen, 0, L, Offset = -40 );
PlotShapes( IIf( Buy, shapeSquare, shapeNone ), colorLime, 0, L, Offset = -50 );
PlotShapes( IIf( Buy, shapeUpArrow, shapeNone ), colorWhite, 0, L, Offset = -45 );
PlotShapes( IIf( Short, shapeSquare, shapeNone ), colorRed, 0, H, Offset = 40 );
PlotShapes( IIf( Short, shapeSquare, shapeNone ), colorOrange, 0, H, Offset = 50 );
PlotShapes( IIf( Short, shapeDownArrow, shapeNone ), colorWhite, 0, H, Offset = -45 );

PlotShapes( IIf( Cover, shapeSmallUpTriangle, shapeNone ), colorYellow, 0, L, Offset = -40 );
PlotShapes( IIf( Sell, shapeSmallDownTriangle, shapeNone ), colorWhite, 0, H, Offset = -40 );

_SECTION_END();

////////////////////////          DAY SEPERATOR              /////////////////////////////
_SECTION_BEGIN( "Day Seperator, EOD, Current Price" );
nday = IIf( Day() != Ref( Day(), -1 ), 1, 0 );
Plot( nday, "", 3, styleHistogram | styleDashed | styleNoLabel | styleOwnScale, 0, 1 );
_SECTION_END();

////////////////////PLOT NAME STRATEGY NAME, PRICE, FULL NAME ETC ON CHART//////////////////
_SECTION_BEGIN( "Get Strategy Name on Chart" );
x = 1;
y = 1;

GfxGradientRect( 1, 1, 1400, 35, colorGrey50, colorDarkGrey );
GfxSetBkMode( 0 );

GfxSelectFont( "Comic Sans MS", 10, 500, False );
GfxSetTextColor( colorYellow );
GfxTextOut( Interval( 2 ), x + 25, y + 20 );

GfxSelectFont( "Tahoma", 10, 1200, False );
GfxSetTextColor( colorWhite );
GfxTextOut( "RBO With TGT & SL", x + 90, y + 20 );

GfxSelectFont( "Arial", 11, 50, False );
GfxSetTextColor( colorWhite );
GfxTextOut( Date(), x + 325, y + 20 );

GfxSelectFont( "Tahoma", 13, 750, False );
GfxSetTextColor( colorGold );
GfxTextOut( Name(), x + 485, y + 18 );

GfxSelectFont( "Tahoma", 13, 750, False );
GfxSetTextColor( colorLavender );
GfxTextOut( FullName(), x + 675, y + 18 );

GfxSelectFont( "Comic Sans MS", 16, 525, False );
GfxSetTextColor( colorYellow );
GfxTextOut( "  " + C, x + 925, y + 10 );

YC = TimeFrameGetPrice( "C", inDaily, -1 );
DD = Prec( C - YC, 2 );
xx = Prec( ( DD / YC ) * 100, 2 );
PercH = C > YC;
PercL = C < YC;

GfxSelectFont( "Comic Sans MS", 10, 525, False );
GfxSetTextColor( colorYellow );
GfxTextOut( "" + DD + "  (" + xx + "%)", x + 925, y + 38 );

_SECTION_END();
7 comments
Leave Comment
Please login here to leave a comment.
i HAVE DOUBT IN AFL SCREEN SHOT ATTACHED FOR MY DOUBT! http://()
Hi Muthu, Just run the afl in your amibroker with similar SL and Tgts and you will see the exact picture what I have given here.
To use this afl,,,,,you have to understand your script as to what kind of moves can your script make and then put levels accordingly.
Eg – If you put 2% SL for Banknifty and 2% Tgt then rarely you will achieve these levels. You may have to put 0.25% as Sl and 0.5% as Tgt. It will work well there;
Also for eg – if for Just dial you expect a move say today then ofcourse you can not put 0.25/0.5 as sl and tgt. See the movement in that script over last few days. This kind of script may need 2% as Sl and 5% as Tgt.
Try it and let me know if you still feel some doubt.
I have given u with Script name – Centurytex Futures for 28 Sep, Oct1, Oct3 and Oct4 charts of 2018. 5Min timeframe. Try it and then let me know if the screenshot is wrong.
Cheers
no scan no explore
Hi georgiansanjay94,
Can you give me your gmail or any mail ?
I have some ideal talk to you.
Sincerely
Hi, Dominic
I think giving email here on the platform is not allowed.
Only if the admin permits then i can provide you with the mail id, else no.
Admin pls….
You can it’s okay.