Stock Portfolio Organizer
The ultimate porfolio management solution.
WiseTrader Toolbox
#1 Selling Amibroker Plugin featuring:
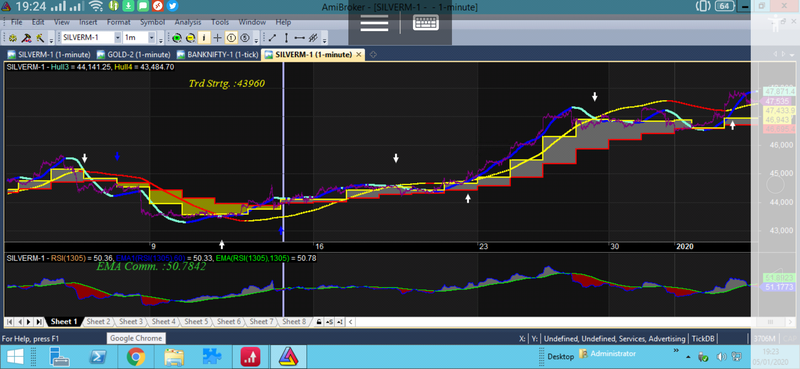
Timeframe crossover for Amibroker (AFL)
//////////////////////////////////////////////////////////////////////////////////////////////////////////////////////////////////////////////////////////////////////////////////////////////////////////
_SECTION_BEGIN(“Fast MA”);
SetChartOptions(2,chartShowDates);
Plot(C,"",1,64);
PP = 0;
WDH = ParamList(“TF”, “Hourly,Daily,Weekly,Minutely” );
if( WDH == “Daily” ) PP= inDaily;
if( WDH == “Weekly” ) PP= inWeekly;
if( WDH == “Hourly” ) PP= inHourly;
if( WDH == “Minutely” ) PP= in15Minute;
TimeFrameSet(PP);
P=ParamField(“Price”);
Per=Param(“MA Period”,2,1,900,1);
x=TEMA;
TimeFrameRestore();
aa=TimeFrameExpand(x,PP);
Plot(aa,"",colorBrightGreen,styleLine);
_SECTION_END();
_SECTION_BEGIN(“Slow MA”);
SetChartOptions(2,chartShowDates);
//Plot(C,"",1,64);
PPS = 0;
WDH = ParamList(“TF”, “Hourly,Daily,Weekly,Minutely” );
if( WDH == “Daily” ) PPS= inDaily;
if( WDH == “Weekly” ) PPS= inWeekly;
if( WDH == “Hourly” ) PPS= inHourly;
if( WDH == “Minutely” ) PPS= in15Minute;
TimeFrameSet(PPS);
P=ParamField(“Average”);
Per=Param(“MA Period”,3,1,900,1);
x=TEMA;
TimeFrameRestore();
y=TimeFrameExpand(x,PPS);
Plot(y,"",colorCustom5,styleLine);
_SECTION_END();
Buy= Cross (aa,y);
Short= Cross (y,aa);
Buy=ExRem(Buy,Short);
Short=ExRem(Short,Buy);
PlotShapes(IIf(Buy, shapeUpArrow, shapeNone),colorWhite, 0,L, Offset=-45);
PlotShapes(IIf(Short, shapeDownArrow, shapeNone),colorWhite, 0,H, Offset=-45);
Filter=Buy OR Short;
_SECTION_BEGIN(“Plot Text in Chart”);
rt=AmiTradingSA();
//Plot(Close,"Price EMA crossover “,color=colorGreen,style=styleCandle);
GfxSelectFont(”Times New Roman", 13, 250, True );
GfxSetBkMode( colorWhite );
GfxSetTextColor( colorYellow );
GfxTextOut(“Close Price Timeframe Crossover :”+C, 500 , 25 );
_SECTION_END();
/////////////////////////////////////////////////////////////////////////////////////////////////////////////////////////////////////////////////////////////////////////////////////////////////////////////
/////////////////////////////////////////////////////////////////////////////////////////////////////////////////////////////////////////////////////////////////////////////////////////////////////////////
//next bar
SECTION_BEGIN(“Fill Color”);
m = aa;
s = y;
Cloudswitch = ParamToggle(“Fill Color”,“On,Off”);
dynamic_color = IIf( aa > y , ParamColor(“Down Color”, colorBrightGreen ), ParamColor(“Up Color”, colorRose ));
PlotOHLC( IIf(Cloudswitch,-1e10,m),IIf(Cloudswitch,-1e10,m),IIf(Cloudswitch,-1e10,s),IIf(Cloudswitch,-1e10,m), "", dynamiccolor, styleNoLabel | styleCloud );
_SECTION_END();
////
GraphXSpace=Param(“GraphXSpace”,45,-100,300,1);
////////////////////////
Screenshots

1 comments
Leave Comment
Please login here to leave a comment.
Back
Best for long term