Psychological index for Amibroker (AFL)
hungkisvn over 7 years ago Amibroker (AFL)
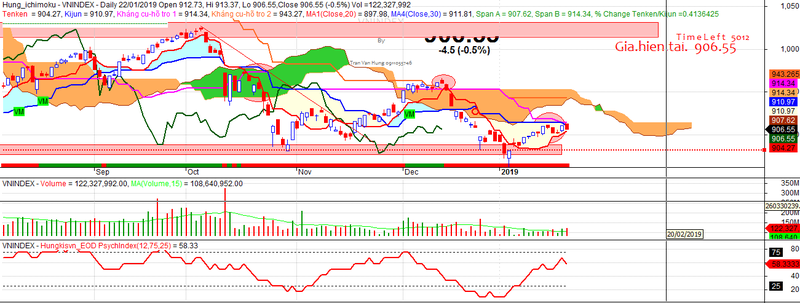
A sentiment indicator that help to determine market bottoms as well as short term swings. It works by calculating the percentage of up days over the look back period.
Screenshots
Indicator / Formula
Copy & Paste Friendly
Psychological index
_SECTION_BEGIN("Hungkisvn_EOD PsychIndex");
LookBack= Param("Number of lookback periods",12, 2, 100);
UThreshold= Param("Upper threshold (%)",75, 0, 100);
LThreshold= Param("Lower threshold (%)", 25,0, 100);
UpDay= Close > Ref(Close,-1);
PsychIndex= 100*Sum(UpDay,LookBack) / LookBack;
Plot(PsychIndex,_DEFAULT_NAME(),ParamColor("Color",colorRed), ParamStyle("Style",styleLine));
Plot(UThreshold,"75",colorBlack,styleDashed|styleNoTitle);
Plot(LThreshold,"25",colorBlack,styleDashed|styleNoTitle);
_SECTION_END();
1 comments
Leave Comment
Please login here to leave a comment.
Reasonably good one. Good work. You are very near to a good logic. You may draw two lines like MACD where the crossover can be taken as buy signal though you gave two horizontal lines on top and bottom, the cross over will be perfect.