TEMA Cross Over for Strong Trend Stocks (Too Early signal) for Amibroker (AFL)
mohangbox over 7 years ago Amibroker (AFL)
Triple Exponential Moving Average Technical Indicator (TEMA) was developed by Patrick Mulloy and published in the “Technical Analysis of Stocks & Commodities” magazine. TEMA can be used instead of traditional moving averages. It can be used for smoothing price data, as well as for smoothing other indicators.
r1=9;
r2=26;
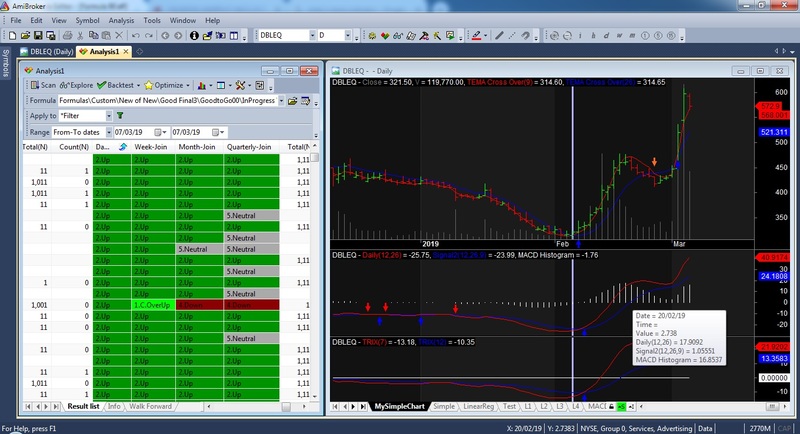
Screenshots
Indicator / Formula
Copy & Paste Friendly
Apply to price chart
///******************************************************************************************************************************************************
///******************************************************************************************************************************************************
///TEMA Cross Over for Strong Trend Stocks (Too Early signal)
///******************************************************************************************************************************************************
///******************************************************************************************************************************************************
//TimeFrameSet(in1Minute);
//TimeFrameSet(in5Minute);
//TimeFrameSet(in15Minute);
//TimeFrameSet(inHourly);
TimeFrameSet(inDaily);
//TimeFrameSet(inWeekly);
//TimeFrameSet(inMonthly);
//TimeFrameSet(inQuarterly);

_SECTION_BEGIN("TEMA Cross Over");

r1=9;
r2=26;

Plot (C, "Close", colorGrey50, styleBar|styleLine);
Plot (V, "V", colorGrey40, styleHistogram|styleOwnScale|styleNoLabel);

Plot(TEMA(C, r1), StrFormat(_SECTION_NAME()+"(%g)", r1), colorRed, styleLine);
Plot(TEMA(C, r2), StrFormat(_SECTION_NAME()+"(%g)", r2), colorBlue, styleLine);

Buy=Cross(TEMA(C, r1) ,TEMA(C, r2));
Sell=Cross(TEMA(C, r2), TEMA(C, r1));
Buy=ExRem(Buy,Sell);
Sell=ExRem(Sell,Buy);

PlotShapes(IIf(Buy, shapeUpArrow, shapeNone),colorBlue, 0, TEMA(C, r1), Offset=-20);
PlotShapes(IIf(Sell, shapeDownArrow, shapeNone),colorOrange, 0, TEMA(C, r1), Offset=-20);

_SECTION_END();
TimeFrameRestore();
1 comments
Leave Comment
Please login here to leave a comment.
addcolumn ada tidak sobat