Show Highest and Lowest Candle In 200, 100, 50 Bars for Amibroker (AFL)
mrdungx about 7 years ago Amibroker (AFL)
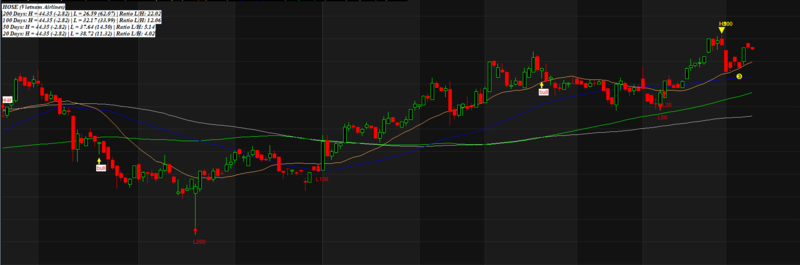
This indicator helps show you which candle bar is the highest or lowest in the range of 200, 100 or 50 bars.
Screenshots
Indicator / Formula
Copy & Paste Friendly
This indicator help you show on the highest or lowest candle bar in range 200, 100 or 50 bars
/*
1. Hien thi gia cao/ thap nhat trong 52 tuan
2. Hien thi gia cao/ thap nhat trong 4 tuan
3. Hien thi gia cao/ thap nhat trong 1 tuan
*/
GfxSelectFont("Times New Roman", 10, 700, True );
y = 20;
y_space = 15;
xx = 5;
GfxTextOut(FullName(), xx, y );
function findHighAndLowValue(TimeRange)
{
	HH = HHV(Ref(H, -1), TimeRange);
	printf(NumToStr(HH) + "  " + NumToStr(BarCount) + " ");
	//PlotShapes(IIf(H == HH, shapeDigit1, shapeNone), colorYellow, 0, High, 10);
	// Phan tram giam tu dinh
	HHPercent = (C - HH)*100/HH;
	LL = LLV(Ref(L, -1), TimeRange);
	// Phan tram tang tu day
	LLPercent = (C - LL)*100/LL;
	L_H_Ratio = IIf(LLPercent >= 0, LLPercent, 100 + abs(LLPercent))/IIf(HHPercent < 0, abs(HHPercent), 100 + HHPercent);

	bi = BarIndex();
	highestBar = ValueWhen(H == LastValue(HH), bi);
	i = LastValue(highestBar);
	PlotText( "H" + NumToStr(TimeRange, 1.0), i, H[ i ], colorYellow, colorDefault, 20);
	PlotShapes((BarIndex()==i)*shapeDownTriangle, colorYellow, 0, High, -10);

	bi = BarIndex();
	lowestBar = ValueWhen(L == LastValue(LL), bi);
	i = LastValue(lowestBar);
	PlotText( "L" + NumToStr(TimeRange, 1.0), i, L[ i ], colorRed, colorDefault, -20);
	PlotShapes((BarIndex()==i)*shapeUpArrow, colorRed, 0, Low, 10);

	return "H = " + NumToStr(HH, 1.2) + " (" + NumToStr(HHPercent, 1.2) + ") | L = " + NumToStr(LL, 1.2) + " (" + NumToStr(LLPercent, 1.2) + ")" + " | Ratio L/H: " + NumToStr(L_H_Ratio, 1.2);
}

GfxTextOut("200 Days: " + findHighAndLowValue(200), xx , y + y_space);
GfxTextOut("100 Days: " + findHighAndLowValue(100), xx , y + 2*y_space);
GfxTextOut("50 Days: " + findHighAndLowValue(50), xx , y + 3*y_space);
GfxTextOut("20 Days: " + findHighAndLowValue(20), xx , y + 4*y_space);
bi = BarIndex();
cprice = C;
PlotShapes(shapeDigit3*(bi == (BarCount - 4)), colorYellow, 0, Low, -15);
2 comments
Leave Comment
Please login here to leave a comment.
Thank you
Sometimes the numbers will be merged and unclear solution possible
I mean the txt