ATR Based Tradng for Amibroker (AFL)
balaji8775 almost 7 years ago Amibroker (AFL)
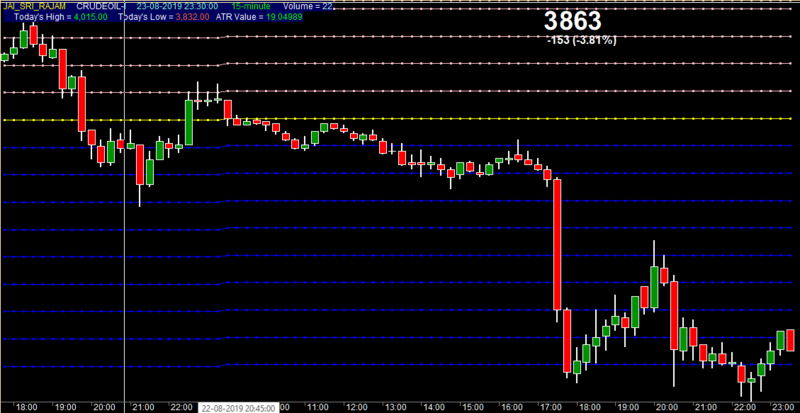
Hi All,Here is my another AFL.Concept was shared by someone which i don’t remember now, but since I liked it just tried to visualize it in this AFL. Check the previous day’s last candle ATR by clicking on it, then enter it in parameter, it will plot levels for next day trading. watch the high low break and trade in that direction keeping the next up or down levels as targets and SL. These lines actually act as Resistance and Support. Time frame can be from 10 to 30miniutes as per your choice.
Note:pls forgive me if any mistakes as i do these s it is my Hobby.
Screenshots
Indicator / Formula
ATR Based Tradining System
_SECTION_BEGIN("Price");
SetChartOptions(0,chartShowDates);
SetChartBkGradientFill( ParamColor("BgTop", colorBlack),
ParamColor("BgBottom", colorBlack),ParamColor("titleblock",colorDarkTeal ));_SECTION_BEGIN( "Price" );
SetChartOptions( 0, chartShowDates );
SetChartBkGradientFill( ParamColor( "BgTop", colorBlack ),
                        ParamColor( "BgBottom", colorBlack ), ParamColor( "titleblock", colorDarkTeal ) );
SetBarFillColor( IIf( C > O, ParamColor( "Candle UP Color", colorGreen ), IIf( C <= O, ParamColor( "Candle Down Color", colorRed ), colorLightGrey ) ) );
Plot( C, "\nPrice", IIf( C > O, ParamColor( "Wick UP Color", colorWhite ), IIf( C <= O, ParamColor( "Wick Down Color", colorWhite ), colorLightGrey ) ), 64, 0, 0, 0, 0 );
GraphXSpace = Param( "Chart vertical Size", 2, 0, 50, 1, 0 );
_SECTION_END();

_SECTION_BEGIN( "Title" );
SetChartOptions( 0, chartShowDates );
dec = ( Param( "Decimals", 2, 0, 7, 1 ) / 10 ) + 1;
PH = TimeFrameGetPrice( "H", inDaily, -1 );     // Yesterdays high
PL = TimeFrameGetPrice( "L", inDaily, -1 ); //Yesterday's Low
TH = TimeFrameGetPrice( "H", inDaily, 0 );     // Today's high
TL = TimeFrameGetPrice( "L", inDaily, 0 ); //Today's Low
ATRV = ATR( 14 );

if( Status( "action" ) == actionIndicator )
    ( Title = EncodeColor( colorYellow ) + "JAI_SRI_RAJAM" + "     " + EncodeColor( 55 ) +  Name() + "     " + EncodeColor( colorAqua ) + Date() + "      " + EncodeColor( 5 ) + "{{INTERVAL}}  " + EncodeColor( 55 ) + "    Volume = " + EncodeColor( 52 ) + WriteVal( V, 1 ) + "\n" +
              EncodeColor( 55 ) + "     Today's High = " + EncodeColor( 5 ) + WriteVal( TH, dec ) +
              EncodeColor( 55 ) + "     Today's Low = " + EncodeColor( colorOrange ) + WriteVal( TL, dec ) +
              EncodeColor( 55 ) + "   ATR Value = " + EncodeColor( colorBrightGreen ) + ATRV );

_SECTION_END();

_SECTION_BEGIN( "Sri_Rajam_Strategy" );

FirstTradeTime = 093000;				// Earliest time to take a trade
LastTradeTime = 144000;					// Latest time to take new trades
ExitAllPositionsTime = 151000;		// Exit all trades

ATRYC = Param( "Enter ATR Value", 1, 0, 500, 1, 0 );
NewDay = ( Day() != Ref( Day(), -1 ) ) OR BarIndex() == 0;
printf( "\n NewDay  : " + NewDay );
FirstBarTime = ValueWhen( NewDay, TimeNum(), 1 );

FCD = ValueWhen( NewDay, C, 1 );
H1 = FCD + ATRYC;
H2 = FCD + ( 2 * ATRYC );
H3 = FCD + ( 3 * ATRYC );
H4 = FCD + ( 4 * ATRYC );
H5 = FCD + ( 5 * ATRYC );
H6 = FCD + ( 6 * ATRYC );
H7 = FCD + ( 7 * ATRYC );
H8 = FCD + ( 8 * ATRYC );
H9 = FCD + ( 9 * ATRYC );
L1 = FCD - ATRYC;
L2 = FCD - ( 2 * ATRYC );
L3 = FCD - ( 3 * ATRYC );
L4 = FCD - ( 4 * ATRYC );
L5 = FCD - ( 5 * ATRYC );
L6 = FCD - ( 6 * ATRYC );
L7 = FCD - ( 7 * ATRYC );
L8 = FCD - ( 8 * ATRYC );
L9 = FCD - ( 9 * ATRYC );

LVLS = ParamToggle( "Trigger Levels", "Show|Hide", 0 );

if( LVLS == 1 )
{
    Plot( FCD, "", colorYellow, styleDots | styleLine | styleNoRescale | styleNoTitle );
    Plot( H1, "", colorPink, styleDots | styleLine | styleNoRescale | styleNoTitle );
    Plot( H2, "", colorPink, styleDots | styleLine | styleNoRescale | styleNoTitle );
    Plot( H3, "", colorPink, styleDots | styleLine | styleNoRescale | styleNoTitle );
    Plot( H4, "", colorPink, styleDots | styleLine | styleNoRescale | styleNoTitle );
    Plot( H5, "", colorPink, styleDots | styleLine | styleNoRescale | styleNoTitle );
    Plot( H6, "", colorPink, styleDots | styleLine | styleNoRescale | styleNoTitle );
    Plot( H7, "", colorPink, styleDots | styleLine | styleNoRescale | styleNoTitle );
    Plot( H8, "", colorPink, styleDots | styleLine | styleNoRescale | styleNoTitle );
    Plot( H9, "", colorPink, styleDots | styleLine | styleNoRescale | styleNoTitle );

    Plot( L1, "", colorBlue, styleDots | styleLine | styleNoRescale | styleNoTitle );
    Plot( L2, "", colorBlue, styleDots | styleLine | styleNoRescale | styleNoTitle );
    Plot( L3, "", colorBlue, styleDots | styleLine | styleNoRescale | styleNoTitle );
    Plot( L4, "", colorBlue, styleDots | styleLine | styleNoRescale | styleNoTitle );
    Plot( L5, "", colorBlue, styleDots | styleLine | styleNoRescale | styleNoTitle );
    Plot( L6, "", colorBlue, styleDots | styleLine | styleNoRescale | styleNoTitle );
    Plot( L7, "", colorBlue, styleDots | styleLine | styleNoRescale | styleNoTitle );
    Plot( L8, "", colorBlue, styleDots | styleLine | styleNoRescale | styleNoTitle );
    Plot( L9, "", colorBlue, styleDots | styleLine | styleNoRescale | styleNoTitle );

}

COND1 = Ref( L, -1 ) < L1 AND Ref( H, -1 ) > L1;
COND2 = Ref( L, -1 ) < L2 AND Ref( H, -1 ) > L2;
COND3 = Ref( L, -1 ) < L3 AND Ref( H, -1 ) > L3;
COND4 = Ref( L, -1 ) < L4 AND Ref( H, -1 ) > L4;
COND5 = Ref( L, -1 ) < L5 AND Ref( H, -1 ) > L5;
COND6 = Ref( L, -1 ) < L6 AND Ref( H, -1 ) > L6;
COND7 = Ref( L, -1 ) < L7 AND Ref( H, -1 ) > L7;
COND8 = Ref( L, -1 ) < L8 AND Ref( H, -1 ) > L8;
COND9 = Ref( L, -1 ) < L9 AND Ref( H, -1 ) > L9;
COND10 = Ref( L, -1 ) < H1 AND Ref( H, -1 ) > H1;
COND11 = Ref( L, -1 ) < H2 AND Ref( H, -1 ) > H2;
COND12 = Ref( L, -1 ) < H3 AND Ref( H, -1 ) > H3;
COND13 = Ref( L, -1 ) < H4 AND Ref( H, -1 ) > H4;
COND14 = Ref( L, -1 ) < H5 AND Ref( H, -1 ) > H5;
COND15 = Ref( L, -1 ) < H6 AND Ref( H, -1 ) > H6;
COND16 = Ref( L, -1 ) < H7 AND Ref( H, -1 ) > H7;
COND17 = Ref( L, -1 ) < H8 AND Ref( H, -1 ) > H8;
COND18 = Ref( L, -1 ) < H9 AND Ref( H, -1 ) > H9;

BCOND = Ref( C, -1 ) > Ref( O, -1 ) AND COND1 OR COND2 OR COND3 OR COND4 OR COND5 OR COND6 OR COND7 OR COND8 OR COND9 OR COND10 OR COND11 OR COND12 OR COND13 OR COND14 OR COND15 OR COND16 OR COND17 OR COND18;

SCOND = Ref( C, -1 ) < Ref( O, -1 ) AND COND1 OR COND2 OR COND3 OR COND4 OR COND5 OR COND6 OR COND7 OR COND8 OR COND9 OR COND10 OR COND11 OR COND12 OR COND13 OR COND14 OR COND15 OR COND16 OR COND17 OR COND18;


Buy = C > Ref( H, -1 )AND BCOND AND( TimeNum() >= FirstTradeTime AND TimeNum() <= LastTradeTime );
Sell = C < Ref( L, -1 )AND SCOND AND( TimeNum() >= FirstTradeTime AND TimeNum() <= LastTradeTime );

_SECTION_END();

_SECTION_BEGIN( "Magnified Market Price" );

FS = Param( "Font Size", 28, 11, 100, 1 );
GfxSelectFont( "Arial", FS, 700, italic = False, underline = False, True );
GfxSetBkMode( colorWhite );
GfxSetTextColor( ParamColor( "Color", colorWhite ) );

Hor = Param( "Horizontal Position", 766, 1, 1200, 1 );
Ver = Param( "Vertical Position", 1, 1, 1, 1 );
GfxTextOut( "" + C, Hor , Ver );
GfxTextOut( Name(), Hor, Ver - 50 );
YC = TimeFrameGetPrice( "C", inDaily, -1 );
DD = Prec( C - YC, 2 );
xx = Prec( ( DD / YC ) * 100, 2 );
GfxSelectFont( "Arial", 12, 700, italic = False, underline = False, True );
GfxSetBkMode( colorWhite );
GfxSetTextColor( ParamColor( "Color", colorViolet ) );
GfxTextOut( "" + DD + " (" + xx + "%)", Hor + 5, Ver + 45 );

_SECTION_END();
SetBarFillColor(IIf(C>O,ParamColor("Candle UP Color", colorGreen),IIf(C<=O,ParamColor("Candle Down Color", colorRed),colorLightGrey)));
Plot(C,"\nPrice",IIf(C>O,ParamColor("Wick UP Color", colorWhite),IIf(C<=O,ParamColor("Wick Down Color", colorWhite),colorLightGrey)),64,0,0,0,0);
GraphXSpace=Param("Chart vertical Size",2,0,50,1,0);
_SECTION_END();

_SECTION_BEGIN("Title");
SetChartOptions(0,chartShowDates);
dec = (Param("Decimals",2,0,7,1)/10)+1;
PH = TimeFrameGetPrice("H", inDaily, -1);       // Yesterdays high
PL = TimeFrameGetPrice("L", inDaily, -1);  //Yesterday's Low
TH = TimeFrameGetPrice("H", inDaily, 0);       // Today's high
TL = TimeFrameGetPrice("L", inDaily, 0);  //Today's Low
ATRV=ATR(14);
if( Status("action") == actionIndicator )
(Title = EncodeColor(colorYellow)+ "JAI_SRI_RAJAM" + "     " + EncodeColor(55)+  Name() + "     " + EncodeColor(colorAqua) + Date() + "      " + EncodeColor(5) + "{{INTERVAL}}  " + EncodeColor(55)+ "    Volume = "+ EncodeColor(52)+ WriteVal(V,1) + "\n" +
EncodeColor(55)+ "     Today's High = "+ EncodeColor(5) + WriteVal(TH,dec) +
EncodeColor(55)+ "     Today's Low = "+ EncodeColor(colorOrange)+ WriteVal(TL,dec) +
EncodeColor(55)+ "   ATR Value = " + EncodeColor(colorBrightGreen) + ATRV);
_SECTION_END();

_SECTION_BEGIN("Sri_Rajam_Strategy");

FirstTradeTime = 093000;				// Earliest time to take a trade
LastTradeTime = 144000;					// Latest time to take new trades
ExitAllPositionsTime = 151000;		// Exit all trades

ATRYC=Param("Enter ATR Value",1,0,500,1,0);
NewDay = (Day()!= Ref(Day(), -1)) OR BarIndex() == 0;
printf("\n NewDay  : " + NewDay );
FirstBarTime = ValueWhen(NewDay,TimeNum(),1);

FCD= ValueWhen(NewDay,C,1);
H1=FCD+ATRYC;
H2= FCD+(2*ATRYC);
H3= FCD+(3*ATRYC);
H4= FCD+(4*ATRYC);
H5= FCD+(5*ATRYC);
H6= FCD+(6*ATRYC);
H7= FCD+(7*ATRYC);
H8= FCD+(8*ATRYC);
H9= FCD+(9*ATRYC);
L1=FCD-ATRYC;
L2=FCD-(2*ATRYC);
L3=FCD-(3*ATRYC);
L4=FCD-(4*ATRYC);
L5=FCD-(5*ATRYC);
L6=FCD-(6*ATRYC);
L7=FCD-(7*ATRYC);
L8=FCD-(8*ATRYC);
L9=FCD-(9*ATRYC);

LVLS = ParamToggle("Trigger Levels","Show|Hide",0);

if(LVLS==1)  {
Plot(FCD,"",colorYellow,styleDots|styleLine|styleNoRescale|styleNoTitle);
Plot(H1,"",colorPink,styleDots|styleLine|styleNoRescale|styleNoTitle);
Plot(H2,"",colorPink,styleDots|styleLine|styleNoRescale|styleNoTitle);
Plot(H3,"",colorPink,styleDots|styleLine|styleNoRescale|styleNoTitle);
Plot(H4,"",colorPink,styleDots|styleLine|styleNoRescale|styleNoTitle);
Plot(H5,"",colorPink,styleDots|styleLine|styleNoRescale|styleNoTitle);
Plot(H6,"",colorPink,styleDots|styleLine|styleNoRescale|styleNoTitle);
Plot(H7,"",colorPink,styleDots|styleLine|styleNoRescale|styleNoTitle);
Plot(H8,"",colorPink,styleDots|styleLine|styleNoRescale|styleNoTitle);
Plot(H9,"",colorPink,styleDots|styleLine|styleNoRescale|styleNoTitle);

Plot(L1,"",colorBlue,styleDots|styleLine|styleNoRescale|styleNoTitle);
Plot(L2,"",colorBlue,styleDots|styleLine|styleNoRescale|styleNoTitle);
Plot(L3,"",colorBlue,styleDots|styleLine|styleNoRescale|styleNoTitle);
Plot(L4,"",colorBlue,styleDots|styleLine|styleNoRescale|styleNoTitle);
Plot(L5,"",colorBlue,styleDots|styleLine|styleNoRescale|styleNoTitle);
Plot(L6,"",colorBlue,styleDots|styleLine|styleNoRescale|styleNoTitle);
Plot(L7,"",colorBlue,styleDots|styleLine|styleNoRescale|styleNoTitle);
Plot(L8,"",colorBlue,styleDots|styleLine|styleNoRescale|styleNoTitle);
Plot(L9,"",colorBlue,styleDots|styleLine|styleNoRescale|styleNoTitle);

}

COND1=Ref(L,-1)<L1 AND Ref(H,-1)>L1;
COND2=Ref(L,-1)<L2 AND Ref(H,-1)>L2;
COND3=Ref(L,-1)<L3 AND Ref(H,-1)>L3;
COND4=Ref(L,-1)<L4 AND Ref(H,-1)>L4;
COND5=Ref(L,-1)<L5 AND Ref(H,-1)>L5;
COND6=Ref(L,-1)<L6 AND Ref(H,-1)>L6;
COND7=Ref(L,-1)<L7 AND Ref(H,-1)>L7;
COND8=Ref(L,-1)<L8 AND Ref(H,-1)>L8;
COND9=Ref(L,-1)<L9 AND Ref(H,-1)>L9;
COND10=Ref(L,-1)<H1 AND Ref(H,-1)>H1;
COND11=Ref(L,-1)<H2 AND Ref(H,-1)>H2;
COND12=Ref(L,-1)<H3 AND Ref(H,-1)>H3;
COND13=Ref(L,-1)<H4 AND Ref(H,-1)>H4;
COND14=Ref(L,-1)<H5 AND Ref(H,-1)>H5;
COND15=Ref(L,-1)<H6 AND Ref(H,-1)>H6;
COND16=Ref(L,-1)<H7 AND Ref(H,-1)>H7;
COND17=Ref(L,-1)<H8 AND Ref(H,-1)>H8;
COND18=Ref(L,-1)<H9 AND Ref(H,-1)>H9;

BCOND = Ref(C,-1)> Ref(O,-1) AND COND1 OR COND2 OR COND3 OR COND4 OR COND5 OR COND6 OR COND7 OR COND8 OR COND9 OR COND10 OR COND11 OR COND12 OR COND13 OR COND14 OR COND15 OR COND16 OR COND17 OR COND18;

SCOND = Ref(C,-1)< Ref(O,-1) AND COND1 OR COND2 OR COND3 OR COND4 OR COND5 OR COND6 OR COND7 OR COND8 OR COND9 OR COND10 OR COND11 OR COND12 OR COND13 OR COND14 OR COND15 OR COND16 OR COND17 OR COND18;


Buy= C >Ref(H,-1)AND BCOND AND (TimeNum() >= FirstTradeTime AND TimeNum() <= LastTradeTime );;
;
Sell= C < Ref(L,-1)AND SCOND AND (TimeNum() >= FirstTradeTime AND TimeNum() <= LastTradeTime );;
;

_SECTION_BEGIN("Magnified Market Price");

FS=Param("Font Size",28,11,100,1);
GfxSelectFont("Arial", FS, 700, italic = False, underline = False, True );
GfxSetBkMode( colorWhite );
GfxSetTextColor( ParamColor("Color",colorWhite) );

Hor=Param("Horizontal Position",766,1,1200,1);
Ver=Param("Vertical Position",1,1,1,1);
GfxTextOut(""+C,Hor , Ver );
GfxTextOut( Name(), Hor,Ver-50 );
YC=TimeFrameGetPrice("C",inDaily,-1);
DD=Prec(C-YC,2);
xx=Prec((DD/YC)*100,2);
GfxSelectFont("Arial", 12, 700, italic = False, underline = False, True );
GfxSetBkMode( colorWhite );
GfxSetTextColor(ParamColor("Color",colorViolet) );
GfxTextOut(""+DD+" ("+xx+"%)", Hor+5, Ver+45 );

_SECTION_END();
3 comments
Leave Comment
Please login here to leave a comment.
Bro….your AFL code is giving me a simple price chart. Not sure if you have copied the right code on this page !
Very good afl, thanks
Good One