EMA10 & EMA 20 5 Min Trading System for Amibroker (AFL)
murali6578 over 6 years ago Amibroker (AFL)
This is purely intraday indicator.
We will enter the trade after or at 09:30
Calculate Yesterdays close and 20 Hourly Moving average
Rules to Enter the trade Close > Yesterday close and
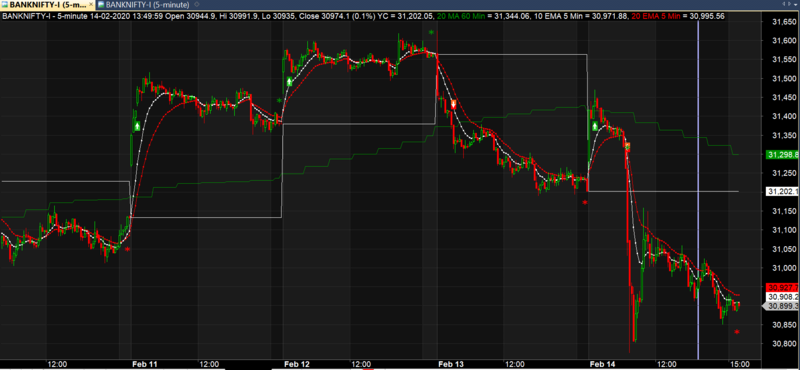
Close > Hourly 20 Moving average and Time > 09:30 and 5 Minutes EMA10 > 5 Minutes EMA20
The Success ratio of this is 48% tested on BANK NIFTY for 2 Years data.
Screenshots
Indicator / Formula
Copy & Paste Friendly
5 Min EMA10 EMA 20 and Yesterday close Hourly 20 MA based Intraday Indictor
_SECTION_BEGIN("Price");
SetChartOptions(0,chartShowArrows|chartShowDates);
_N(Title = StrFormat("{{NAME}} - {{INTERVAL}} {{DATE}} Open %g, Hi %g, Lo %g, Close %g (%.1f%%) {{VALUES}}", O, H, L, C, SelectedValue( ROC( C, 1 ) ) ));
Plot( C, "Close", ParamColor("Color", colorDefault ), styleNoTitle | ParamStyle("Style") | GetPriceStyle() );
_SECTION_END();
PositionSize = MarginDeposit=1;

// Calculate Yesterdays close
YC = TimeFrameGetPrice("C",inDaily,-1);

Plot(yc,"YC",colorWhite,styleLine);


TimeFrameSet( inHourly); // Set Timeframe to 1 Hour and Calculate 20 Moving average Hourly

 mah_20 = MA(C,20);

 TimeFrameRestore(); // restore time frame to original
TimeFrameSet( in5Minute);// Set the timeframe to 5 Min
 ma5_10 = EMA( C, 10 ); // Calculate 10 EMA 5 Min
 ma5_20 = EMA(C,20);     // Calculate 20 EMA 5 Min

TimeFrameRestore(); // restore time frame to original

Plot( TimeFrameExpand( mah_20, inHourly), "20 MA 60 Min", colorGreen ); // Plot 20 MA Hourly

Plot( TimeFrameExpand( ma5_10, in5Minute), "10 EMA 5 Min", colorWhite,styleDots); // Plot 10 EMA 5 Mi
Plot( TimeFrameExpand( ma5_20, in5Minute), "20 EMA 5 Min", colorRed,styleDots );  // Plot 20 EMA 5 Minutes

Buy =  TimeFrameExpand( ma5_10, in5Minute) > TimeFrameExpand( ma5_20, in5Minute) // Buy Formula
        AND C > yc AND C > TimeFrameExpand( mah_20, inHourly)
             AND TimeNum() > 093000 AND TimeNum() < 151500;


Short=  TimeFrameExpand( ma5_10, in5Minute) < TimeFrameExpand( ma5_20, in5Minute) // Short Formula
        AND C < yc AND C < TimeFrameExpand( mah_20, inHourly)
        AND TimeNum() > 093000 AND TimeNum() < 151500;


sell=Short OR TimeNum() > 152400;

Cover=Buy OR TimeNum() > 152400;

Buy=ExRem(Buy,Sell);
Sell=ExRem(Sell,Buy);
short=ExRem(Short,Cover);
Cover=ExRem(cover,short);

Long=Flip(Buy,Sell);
Shrt=Flip(Short,Cover);

btest = ValueWhen(Buy,C);

BuyPrice=ValueWhen(Buy,C);
SellPrice=ValueWhen(Sell,C);
ShortPrice=ValueWhen(Short,C);
CoverPrice=ValueWhen(Cover,C);

PlotShapes(IIf(Buy, shapeSquare, shapeNone),colorGreen, 0, L, Offset=-40);
PlotShapes(IIf(Buy, shapeSquare, shapeNone),colorLime, 0,L, Offset=-50);
PlotShapes(IIf(Buy, shapeUpArrow, shapeNone),colorWhite, 0,L, Offset=-45);
PlotShapes(IIf(Short, shapeSquare, shapeNone),colorRed, 0, H, Offset=40);
PlotShapes(IIf(Short, shapeSquare, shapeNone),colorOrange, 0,H, Offset=50);
PlotShapes(IIf(Short, shapeDownArrow, shapeNone),colorWhite, 0,H, Offset=-45);
PlotShapes(IIf(sELL, SHAPESTAR, shapeNone),colorgreen, 0,H, Offset=45);
PlotShapes(IIf(Cover, SHAPESTAR, shapeNone),colorred, 0,l, Offset=-45);
1 comments
Leave Comment
Please login here to leave a comment.
good afl. thanks