Stock Portfolio Organizer

The ultimate porfolio management solution.

Shares, Margin, CFD's, Futures and Forex
EOD and Realtime
Dividends and Trust Distributions
And Much More ....
For Portfolio Manager Click Here

WiseTrader Toolbox

#1 Selling Amibroker Plugin featuring:

Advanced Adaptive Indicators
Advanced Pattern Exploration
Neural Networks
And Much More ....
Find Out More Here

Boring / Base Candle Detection for Amibroker (AFL)

Rating:
4 / 5 (Votes 2)
Tags:
amibroker

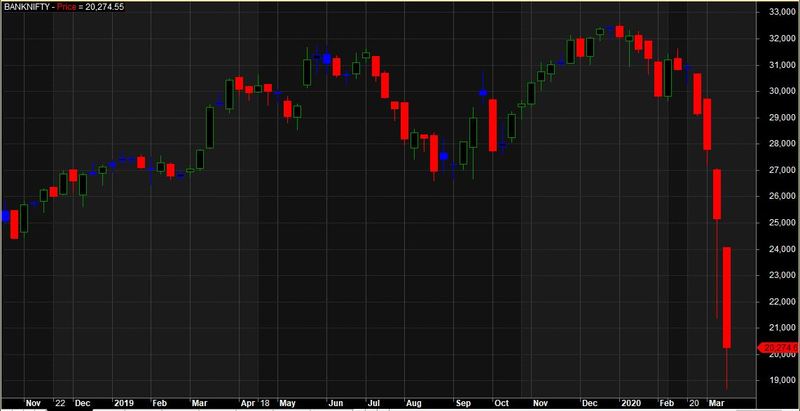
This AFL detects Boring/Base candle if its body (open-close) is less than 50% of candle size (high-low) and changes its color to blue. This is very useful in price action trading.

Screenshots

Indicator / Formula

Copy & Paste Friendly

body (open-close) is less than 50% of candle size (high-low)

normalCandle = (Open < Close);
baseCandle = abs(Open-Close)/abs(High-Close) < 0.5;
BarColor = Iif( baseCandle, colorBlue, IIf(normalCandle, colorGreen, colorRed) );
// set color
Plot( Close, "Price", BarColor, styleCandle );
//PlotOHLC(open, high, low, close, "This is base candle", BarColor, styleCandle);

10 comments

Comment hidden - Show
2. patademahesh

minor correction.

normalCandle = (Open < Close);
baseCandle = abs(Open-Close)/abs(High-Low) < 0.5;
BarColor = Iif( baseCandle, colorBlue, IIf(normalCandle, colorGreen, colorRed) );
// set color
Plot( Close, "Price", BarColor, styleCandle );
3. sku91
_SECTION_BEGIN("T3 Function");
 
SetChartOptions(0,chartShowArrows|chartShowDates);
SetChartBkColor(31) ;
 
 
function T3(price,periods)
 
 
{
s = 0.84;
e1=EMA(price,periods);
e2=EMA(e1,Periods);
e3=EMA(e2,Periods);
e4=EMA(e3,Periods);
e5=EMA(e4,Periods);
e6=EMA(e5,Periods);
c1=-s*s*s;
c2=3*s*s+3*s*s*s;
c3=-6*s*s-3*s-3*s*s*s;
c4=1+3*s+s*s*s+3*s*s;
Ti3=c1*e6+c2*e5+c3*e4+c4*e3;
return ti3;
}
PercentChange = 4;
ZZ = Zig(C,LastValue(PercentChange)) ; 
PivotLow = Ref(IIf(Ref(ROC(ZZ,1),-1) < 0 AND ROC(ZZ,1) > 0, 1, Null),1);
PivotHigh = Ref(IIf(Ref(ROC(ZZ,1),-1) > 0 AND ROC(ZZ,1) < 0, 1, Null),1);
Buy_Valid = IIf(C>(.01+(LastValue(PercentChange)/100))*(ValueWhen(PivotLow, C, 1))
AND ROC(ZZ,1) > 0,1,0); 
 
Color=IIf(Buy_Valid OR PivotLow,5,IIf(NOT Buy_Valid,colorDarkRed,colorBlue));
Plot (C,"Close",color,64,32);
//Plot(C,"",4,64);
Plot(T3(C,50),"T3",colorCustom12,4);
Plot(t3(C,20),"T3",colorBlue,4);
X1=Ref(C,-1);
X1=Ref(C,-2);
 
//Buy=H<T3(C,50) AND H<t3(C,20) AND C>X1 ;
_SECTION_END();
 
Plot (EMA (C,20), "EMA 20",colorCustom11,4);
Plot (EMA (C,45), "EMA 45",colorYellow,4);
Plot (EMA (C,200), "EMA 200",9,4);//colorAqua
Plot (EMA (C,420), "EMA 200",colorAqua,4);//
Plot(TEMA(C+(C/60),2),"C*2",colorBlack,4);
_SECTION_BEGIN("MA");
P = ParamField("Price field",-1);
Periods = Param("Periods", 10, 2, 200, 1 );//colorOrange
//Plot( MA( P, Periods ), _DEFAULT_NAME(),colorOrange, 4); 
_SECTION_END();
 
_SECTION_BEGIN("WMA1");
P = ParamField("Price field",-1);
Periods = Param("Periods",8, 1, 300, 1, 5 );
//Plot( WMA( P, 5 ), "WMA(5)", colorBrightGreen, ParamStyle("Style") ); 
_SECTION_END();
 
 
_SECTION_BEGIN("Colud10");
 
Color = IIf(EMA (C,20) < t3(C,20) , colorWhite,//LightGrey//30
         IIf(EMA (C,20) > t3(C,20),colorGreen,7 ) );//PaleGreen,colorPink
Colori = IIf(T3(C,50) < t3(C,20) , 30,
         IIf(T3(C,50) > t3(C,20), colorLightGrey,7 ) );
PlotOHLC(EMA (C,20), EMA (C,20), t3(C,20) , t3(C,20) , "", Color, styleCloud | styleNoLabel);
PlotOHLC(t3(C,50), t3(C,50), t3(C,20) , t3(C,20) , "", Colori, styleCloud | styleNoLabel);
 
_SECTION_END();
 
_SECTION_BEGIN("Cloud10"); 
Color = IIf(EMA (C,20) < t3(C,20) , colorWhite,//LightGrey//30
         IIf(EMA (C,20) > t3(C,20),12 ,7 ) );//PaleGreen,colorPink
Colori = IIf(T3(C,50) < t3(C,20) , colorGreen,
         IIf(T3(C,50) > t3(C,20), colorLightGrey,7 ) );
PlotOHLC(EMA (C,20), EMA (C,20), t3(C,20) , t3(C,20) , "", Color, styleCloud | styleNoLabel);
PlotOHLC(t3(C,50), t3(C,50), t3(C,20) , t3(C,20) , "", Colori, styleCloud | styleNoLabel);
 
//Buy=H>EMA (C,20) AND Ref(H,-1)<EMA (C,20)AND Ref(H,-2)<EMA (C,20);
 
 
_SECTION_BEGIN("Zig Zag Indicator with Valid Entry and Exit Points");
//------------------------------------------------------------------------------
//
//  Formula Name:    Zig Zag Indicator with Valid Entry and Exit Points
PercentChange = 6;
ZZ = Zig(C,LastValue(PercentChange)) ; 
PivotLow = Ref(IIf(Ref(ROC(ZZ,1),-1) < 0 AND ROC(ZZ,1) > 0, 1, Null),1);
PivotHigh = Ref(IIf(Ref(ROC(ZZ,1),-1) > 0 AND ROC(ZZ,1) < 0, 1, Null),1);
PlotShapes ( IIf(PivotHigh, shapeSmallCircle, shapeNone), colorCustom12,0,H, 5);
PlotShapes( IIf(PivotLow, shapeSmallCircle, shapeNone),  colorBlue,0, L, -5);
 
_SECTION_END();
 
_SECTION_BEGIN("GIP-3");
// -- what will be our lookback range for the hh and ll?
nBars = Param("Number of bars", 12, 5, 40);
bTrace = Param("Include trace output", 1, 0, 1);
nNoPivsInSetup = Param("No. Pivs in Setup", 4, 3, 4, 1);
bShowTCZ = Param("Show TCZ", 1, 0, 1); 
nMinBarsBtwPivs = Param("Min. number of bars btw. pivots", 1, 1, 10, 1);
nMinPctBtwPivs = Param("Min. percent diff. btw. pivots", .05, .04, .2, .01);
bLastBarCanBePiv = Param("Last bar can be a pivot", 1, 0, 1); 
retrcTolerance = .01;
tczTolerance = .005;
nNumBarsToScan = 120;
 
// -- added from exploration version 20040204
nExploreBarIdx = 0;
nExploreDate = 0;
nCurDateNum = 0;
DN = DateNum();
DT = DateTime();
 
// -- key exploration variables
bTCZLong = False;
bTCZShort = False;
nAnchorPivIdx = 0;
 
ADX8 = ADX(8);
 
// 1 - INDICATOR, 2 - COMMENTARY, 3 - SCAN, 
// 4 - EXPLORATION, 5 - BACKTEST / Optimize 
if(Status("action")==1) {
    bDraw = True;
    bUseLastVis = Param("Use last visible bar", 1, 0, 1);
} else {
    bDraw = False;
    bUseLastVis = False;
    bTrace = False;
    nExploreDate = Status("rangetodate");
    for (i=LastValue(BarIndex());i>=0;i--) {
        nCurDateNum = DN[i];
        if (nCurDateNum == nExploreDate) {
            nExploreBarIdx = i;
        }
    }
// -- if(Status("action")==1...
}
 
GraphXSpace=7;
 
// -- Create 0-initialized arrays the size of barcount
aHPivs = H - H;
aLPivs = L - L;
aHPivHighs = H - H;
aLPivLows = L - L;
aHPivIdxs = H - H;
aLPivIdxs = L - L;
aAddedHPivs = H - H;
aAddedLPivs = L - L;
aLegVol = H - H;
aRetrcVol = H - H;
 
nHPivs = 0;
nLPivs = 0;
 
lastHPIdx = 0;
lastLPIdx = 0;
lastHPH = 0;
lastLPL = 0;
curPivBarIdx = 0;
 
// -- looking back from the current bar, how many bars 
//    back were the hhv and llv values of the previous 
//    n bars, etc.?
aHHVBars = HHVBars(H, nBars);
aLLVBars = LLVBars(L, nBars);
aHHV = HHV(H, nBars);
aLLV = LLV(L, nBars);
 
// -- Initialize value of curTrend
nLastVisBar = LastValue(
    Highest(IIf(Status("barvisible"), BarIndex(), 0)));
 
curBar = IIf(nlastVisBar > 0 AND bUseLastVis, nlastVisBar, 
    IIf(Status("action")==4 AND nExploreBarIdx > 0, nExploreBarIdx,
    LastValue(BarIndex())));
 
curTrend = "";
if (aLLVBars[curBar] < aHHVBars[curBar]) 
    curTrend = "D";
else
    curTrend = "U";
 
// -- Make sure there are enough bars!
if (curBar >= nNumBarsToScan) {
    for (i=0; i<nNumBarsToScan; i++) {
     
        // -- value of curBar dependent on two parameters
        curBar = IIf(nlastVisBar > 0 AND bUseLastVis, 
            nlastVisBar-i, 
            IIf(Status("action")==4 AND nExploreBarIdx > 0, 
            nExploreBarIdx-i,
            LastValue(BarIndex())-i));
 
        // -- Have we identified a pivot? If trend is down...
        if (aLLVBars[curBar] < aHHVBars[curBar]) {
     
            // ... and had been up, this is a trend change
            if (curTrend == "U") {
                curTrend = "D";
                // -- Capture pivot information
                curPivBarIdx = curBar - aLLVBars[curBar];
                aLPivs[curPivBarIdx] = 1;
                aLPivLows[nLPivs] = L[curPivBarIdx];
                aLPivIdxs[nLPivs] = curPivBarIdx;
                nLPivs++;
            }
        // -- or current trend is up
        } else {
            if (curTrend == "D") {
                curTrend = "U";
                curPivBarIdx = curBar - aHHVBars[curBar];
                aHPivs[curPivBarIdx] = 1;
                aHPivHighs[nHPivs] = H[curPivBarIdx];
                aHPivIdxs[nHPivs] = curPivBarIdx;
                nHPivs++;
            }
        // --   If curTrend is up...else...
        }       
     
    // -- loop through bars
    } 
}
 
 
// -- Start at last bar. Reestablish curBar
curBar = 
    IIf(nlastVisBar > 0 AND bUseLastVis, 
    nlastVisBar, 
    IIf(Status("action")==4 AND nExploreBarIdx > 0, 
    nExploreBarIdx,
    LastValue(BarIndex()))
    );
 
// -- Make sure I found at least two of each above.
if (nHPivs >= 2 AND nLPivs >= 2) {
 
    lastLPIdx = aLPivIdxs[0];
    lastLPL = aLPivLows[0];
     
    lastHPIdx = aHPivIdxs[0];
    lastHPH = aHPivHighs[0];
     
    nLastHOrLPivIdx = Max(lastLPIdx, lastHPIdx);
     
    nAddPivsRng = curBar - nLastHOrLPivIdx;
    aLLVAfterLastPiv = LLV(L, nAddPivsRng);  
    nLLVAfterLastPiv = aLLVAfterLastPiv[curBar];
    aLLVIdxAfterLastPiv = LLVBars(L, nAddPivsRng);  
    nLLVIdxAfterLastPiv = curBar - aLLVIdxAfterLastPiv[curBar];
    aHHVAfterLastPiv = HHV(H, nAddPivsRng); 
    nHHVAfterLastPiv = aHHVAfterLastPiv[curBar];
    aHHVIdxAfterLastPiv = HHVBars(H, nAddPivsRng); 
    nHHVIdxAfterLastPiv = curBar - aHHVIdxAfterLastPiv[curBar];
     
    // -- Later want to add last high pivot only if
     
    if (lastHPIdx > lastLPIdx) {
     
 
        if (aHPivHighs[0] < aHPivHighs[1]) {
     
            if (nLLVAfterLastPiv < aLPivLows[0] AND
                (nLLVIdxAfterLastPiv - lastHPIdx - 1) >= nMinBarsBtwPivs
                AND nLLVIdxAfterLastPiv != curBar   ) {
     
                // -- OK, we'll add this as a pivot. 
                //    Mark it for plotting...
                aLPivs[nLLVIdxAfterLastPiv] = 1;
                aAddedLPivs[nLLVIdxAfterLastPiv] = 1;
         
                //    ...and then rearrange elements in the 
                //    pivot information arrays
                for (j=0; j<nLPivs; j++) {
                    aLPivLows[nLPivs-j] = aLPivLows[nLPivs-(j+1)];
                    aLPivIdxs[nLPivs-j] = aLPivIdxs[nLPivs-(j+1)];
                }
                aLPivLows[0] = nLLVAfterLastPiv;
                aLPivIdxs[0] = nLLVIdxAfterLastPiv;
                nLPivs++;
     
            // -- Test whether to add piv given last piv is high 
            //    AND we have lower highs   
            }
     
        // -- Here, the last piv is a high piv, and we have 
        //    higher-highs. The most likely addition is a 
        //    Low piv that is a retracement.
        } else {
     
            if (nLLVAfterLastPiv > aLPivLows[0] AND
                (nLLVIdxAfterLastPiv - lastHPIdx - 1) >= nMinBarsBtwPivs
                AND nLLVIdxAfterLastPiv != curBar   ) {
     
                // -- OK, we'll add this as a pivot. 
                //    Mark it for plotting...
                aLPivs[nLLVIdxAfterLastPiv] = 1;
                aAddedLPivs[nLLVIdxAfterLastPiv] = 1;
         
                //    ...and then rearrange elements in the 
                //    pivot information arrays
                for (j=0; j<nLPivs; j++) {
                    aLPivLows[nLPivs-j] = aLPivLows[nLPivs-(j+1)];
                    aLPivIdxs[nLPivs-j] = aLPivIdxs[nLPivs-(j+1)];
                }
                aLPivLows[0] = nLLVAfterLastPiv;
                aLPivIdxs[0] = nLLVIdxAfterLastPiv;
                nLPivs++;
     
            // -- Test whether to add piv given last piv is high 
            //    AND we have lower highs   
            }   
        // -- The last piv is a high and we have higher highs 
        //    OR lower highs
        }
     
    /* ****************************************************************
        Still finding missed pivot(s). Here, the last piv is a low piv.
    **************************************************************** */
    } else {
     
        // -- First case, lower highs
        if (aHPivHighs[0] < aHPivHighs[1]) {
     
            if (nHHVAfterLastPiv < aHPivHighs[0] AND
                (nHHVIdxAfterLastPiv - lastLPIdx - 1) >= nMinBarsBtwPivs
                AND nHHVIdxAfterLastPiv != curBar   ) {
     
                // -- OK, we'll add this as a pivot. 
                //    Mark that for plotting
                aHPivs[nHHVIdxAfterLastPiv] = 1;
                aAddedHPivs[nHHVIdxAfterLastPiv] = 1;
     
                //    ...and then rearrange elements in the 
                //    pivot information arrays
                for (j=0; j<nHPivs; j++) {
                    aHPivHighs[nHPivs-j] = aHPivHighs[nHPivs-(j+1)];
                    aHPivIdxs[nHPivs-j] = aHPivIdxs[nhPivs-(j+1)];
                }
                aHPivHighs[0] = nHHVAfterLastPiv;
                aHPivIdxs[0] = nHHVIdxAfterLastPiv;
                nHPivs++;
     
            // -- Test whether to add piv given last piv is high 
            //    AND we have lower highs   
            }
     
        // -- Second case when last piv is a low piv, higher highs 
        //    Most likely addition is high piv that is a retracement.
        //    Considering adding a high piv as long as it is higher
        } else {
     
            // -- Where I have higher highs,
            if (nHHVAfterLastPiv > aHPivHighs[0] AND
                (nHHVIdxAfterLastPiv - lastLPIdx - 1) >= nMinBarsBtwPivs
                AND nHHVIdxAfterLastPiv != curBar   ) {
     
                // -- OK, we'll add this as a pivot. 
                //    Mark it for plotting...
                aHPivs[nHHVIdxAfterLastPiv] = 1;
                aAddedHPivs[nHHVIdxAfterLastPiv] = 1;
     
                //    ...and then rearrange elements in the 
                //    pivot information arrays
                for (j=0; j<nHPivs; j++) {
                    aHPivHighs[nHPivs-j] = aHPivHighs[nHPivs-(j+1)];
                    aHPivIdxs[nHPivs-j] = aHPivIdxs[nhPivs-(j+1)];
                }
                aHPivHighs[0] = nHHVAfterLastPiv;
                aHPivIdxs[0] = nHHVIdxAfterLastPiv;
                nHPivs++;
     
            // -- Test whether to add piv given last piv is high 
            //    AND we have lower highs   
            }
     
        }
             
    } 
 
// -- If there are at least two of each
}
 
/* ****************************************
// -- Done with finding pivots
***************************************** */
 
if (bDraw) {
 
    // -- OK, let's plot the pivots using arrows
    PlotShapes(
        IIf(aHPivs==1, shapeDownArrow, shapeNone), 
            colorRed, 0,    High, Offset=-15);
    PlotShapes(
        IIf(aAddedHPivs==1, shapeDownArrow, shapeNone),
            colorCustom12, 0, High, Offset=-15);
    PlotShapes(
        IIf(aLPivs==1, shapeUpArrow , shapeNone),       
            5, 0, Low, Offset=-15);
    PlotShapes(
        IIf(aAddedLPivs==1, shapeUpArrow , shapeNone), 
            colorBlue, 0, Low, Offset=-15);
}
 
Buy =  aLPivs OR aAddedLPivs;
Sell = aHPivs OR aAddedHPivs;
 
 
 Title = EncodeColor(colorYellow)+Title =Name() + " " + Date() +EncodeColor( colorYellow) + 
   EncodeColor(55)+ "   Open:  "+ WriteIf(O> Ref(O,-1),EncodeColor(colorBrightGreen),EncodeColor(colorRed))+ WriteVal(O,format=1.2) + 
    EncodeColor(55)+ "   High:  "+ WriteIf(H> Ref(H,-1),EncodeColor(colorBrightGreen),EncodeColor(colorRed))+  WriteVal(H,format=1.2) +
    EncodeColor(55)+ "   Low:  "+ WriteIf(L> Ref(L,-1),EncodeColor(colorBrightGreen),EncodeColor(colorRed))+  WriteVal(L,format=1.2) + 
    EncodeColor(55)+ "   Close:  "+ WriteIf(C> Ref(C,-1),EncodeColor(colorBrightGreen),EncodeColor(colorRed))+ WriteVal(C,format=1.2)+
      EncodeColor(55)+ "   Change:  "+WriteIf(C> Ref(C,-1),EncodeColor(5),EncodeColor(55))+ WriteVal((C-Ref(C,-1)),format=1.2)+  "  ("+ WriteVal(ROC(C,1),format=1.2)+ "%"+ ")  "+
   "\n"+EncodeColor(55)+"Volume   = "+ WriteIf(V> Ref(V,-1),EncodeColor(colorBrightGreen),EncodeColor(colorRed))+ WriteVal(V,format=1.2)+
   "\n"+EncodeColor(55)+"Change:   "+WriteIf(V> Ref(V,-1),EncodeColor(5),EncodeColor(55))+ WriteVal((V-Ref(V,-1)),format=1.2)+  "  ("+ WriteVal(ROC(V,1),format=1.2)+ "%"+ ")  "+
   "\n"+EncodeColor(colorCustom11)+"EMA (C,20)  = "+ WriteVal(EMA (C,20),format=1.2)+
   "\n"+EncodeColor(colorYellow)+"EMA (C,45)  = "+ WriteVal(EMA (C,45),format=1.2)+
   "\n"+EncodeColor(9)+"EMA(C,200) = "+ WriteVal(EMA (C,200),format=1.2)+
   "\n"+EncodeColor(colorAqua)+"EMA(C,420) = "+ WriteVal(EMA (C,420),format=1.2)+
   "\n"+EncodeColor(colorBlue)+"T3(C,20)      = "+ WriteVal(t3(C,20),format=1.2)+
   "\n"+EncodeColor(colorCustom12)+"T3(C,50)      = "+ WriteVal(t3(C,20),format=1.2);


_SECTION_END();

4. uuzar8@gmail.com

nice

5. prathjoshi

its Very good last few days i am working nice result

7. val2004

It does not repaint for you ???

8. patademahesh

yes. It does. Remove default price study and add this.

9. mehtakrunal

@sku91 what is the code about?
Code backtest results gives good but it repaints.
How to use the code in live trading?

10. shivkumarpasi

@sku19 can you please let me know your contact details like email or number please

11. HARPREET

there is an error coming in this indicator sir what will be the solution if you do not mind give you mobile number

Leave Comment

Please login here to leave a comment.

Back