CPR Pivot for Visible Price Action Trading for Amibroker (AFL)
SUSECA about 6 years ago Amibroker (AFL)
Always Price Action Traders look for naked candles on the chart. Most of the times Price responds in Pivots / Support / Resistance. As I experienced, to trade needed the tools viz., Pivots, Fibonacci, Sup/Res Zone Trendline to find the key reversal possible points.
To draw Fibonacci, Sub/Res Zone, Trendline is purely dependent on Price Action Traders. Of course, the quality of marking increases the profitability of traders.
As a concern of Pivot is static in nature, it can plot on the chart without compromise the visibility of candles.
When you combine Price Action with the mentioned tools, you fell the awesome results.
From the above consideration, I draw the solutions is that move the Support and Resistance lines on the blank chart area to reserve the rooms for Price Action.
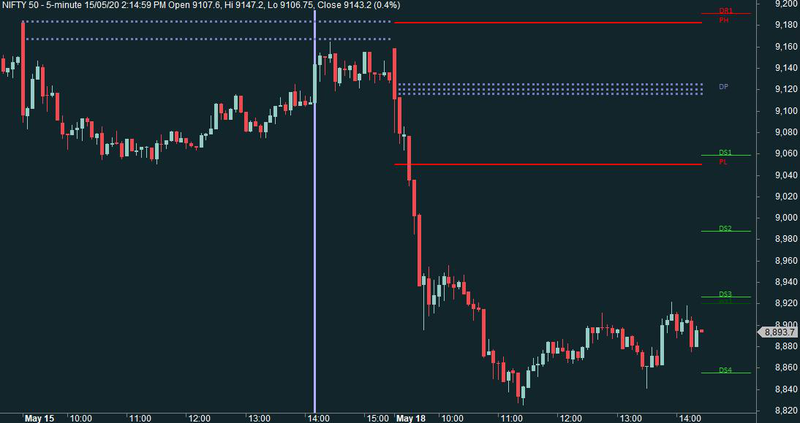
In CPR contains Previous Day High & Low, Daily Supports & Resistance, and Weekly Supports & Resistance.
Enjoy :)
Note: Just I consolidated the needed codes from the web and other indicators loaded in wisestocktrader.com
Screenshots
Indicator / Formula
Independant indicator.
_SECTION_BEGIN("CPR Pivot");
_N(Title = StrFormat("{{NAME}} - {{INTERVAL}} {{DATE}} Open %g, Hi %g, Lo %g, Close %g (%.1f%%) {{VALUES}}", O, H, L, C, SelectedValue( ROC( C, 1 ) ) ));
Plot( C, "Close", ParamColor("Color", colorDefault ), styleNoTitle | ParamStyle("Style") | GetPriceStyle() );


 function CDL( array )
{
    doy = DayOfYear();
    Lastdoy = doy == LastValue( doy );
    Dayline = array * Lastdoy;

    return IIf( Dayline, Dayline, Null );
}


//### COLLECT DAILY INFORMATION OF HIGH, LOW, CLOSE ###//
PH = DayH = TimeFrameGetPrice("H", inDaily, -1);    DayHI = LastValue (DayH,1);   // yesterdays high
PL = DayL = TimeFrameGetPrice("L", inDaily, -1);    DayLI = LastValue (DayL,1); // yesterdays low
PC = DayC = TimeFrameGetPrice("C", inDaily, -1);    // yesterdays close

//### COLLECT DAILY INFORMATION OF HIGH, LOW, CLOSE ###//
wPH = WeekH = TimeFrameGetPrice("H", inWeekly, -1);    WeekHI = LastValue (DayH,1);   // yesterdays high
wPL = WeekL = TimeFrameGetPrice("L", inWeekly, -1);    WeekLI = LastValue (DayL,1); // yesterdays low
wPC = WeekC = TimeFrameGetPrice("C", inWeekly, -1);    // yesterdays close


numbars = LastValue(Cum(Status("barvisible")));
fraction= IIf(StrRight(Name(),3) == "", 3.2, 3.2);
hts = -33.5;


//### DAILY PIVOT CALCULATIONS ###//
fp=(PH+PL+PC)/3; fpI = LastValue (fp,1);
fBC = (PH + PL)/2; fBCI = LastValue (fBC,1);
fTC = (fp - fBC) + fp; fTCI = LastValue ( fTC,1);

fr1 = (2 * fp) - PL; fr1I = LastValue (fr1,1);
fr2 = fp + (PH - PL); fr2I = LastValue (fr2,1);
fr3 = fr1 + (PH - PL); fr3I = LastValue (fr3,1);
fr4 = fr3 + (fr2- fr1); fr4I = LastValue (fr4,1);

fs1 = (2 * fp) - PH; fs1I = LastValue (fs1,1);
fs2 = fp - (PH - PL); fs2I = LastValue (fs2,1);
fs3 = fs1 - (PH - PL); fs3I = LastValue (fs3,1);
fs4 = fs3 - (fs1 - fs2); fs4I = LastValue (fs4,1);

//### WEEK PIVOT CALCULATIONS ###//
wp=(wPH+wPL+wPC)/3; wpI = LastValue (wp,1);
wBC = (wPH + wPL)/2; wBCI = LastValue (wBC,1);
wTC = (wp - wBC) + wp; wTCI = LastValue ( wTC,1);

wr1 = (2 * wp) - wPL; wr1I = LastValue (wr1,1);
wr2 = wp + (wPH - wPL); wr2I = LastValue (wr2,1);
wr3 = wr1 + (wPH - wPL); wr3I = LastValue (wr3,1);
wr4 = wr3 + (wr2- wr1); wr4I = LastValue (wr4,1);

ws1 = (2 * wp) - wPH; ws1I = LastValue (ws1,1);
ws2 = wp - (wPH - wPL); ws2I = LastValue (ws2,1);
ws3 = ws1 - (wPH - wPL); ws3I = LastValue (ws3,1);
ws4 = ws3 - (ws1 - ws2); ws4I = LastValue (ws4,1);


TimeFrame = Interval();

if( TimeFrame < inHourly )
{
totalBars = BarsSince( Day() != Ref(Day(), -1));


//### PLOT DAILY PIVOT LINES ###//
Plot(fp,"DP",ColorRGB(123,123,192),styleDots|styleNoLine|styleNoRescale|styleNoLabel|styleNoTitle);
Plot(fBC,"DBC",ColorRGB(123,123,192),styleDots|styleNoLine|styleNoRescale|styleNoLabel|styleNoTitle);
Plot(fTC,"DTC",ColorRGB(123,123,192),styleDots|styleNoLine|styleNoRescale|styleNoLabel|styleNoTitle);

Plot(cdl(DayH),"PH",colorRed,styleLine|styleThick|styleNoRescale|styleNoLabel|styleNoTitle);
Plot(cdl(DayL),"PL",ColorRed,styleLine|styleThick|styleNoRescale|styleNoLabel|styleNoTitle);


Plot(cdl(fr1),"DR1",colorRed,styleLine|styleNoRescale|styleNoLabel|styleNoTitle ,Null,Null, LastValue(totalBars));


Plot(cdl(fr2),"DR2",colorRed,styleLine|styleNoRescale|styleNoLabel|styleNoTitle ,Null,Null, LastValue(totalBars));
Plot(cdl(fr3),"DR3",colorRed,styleLine|styleNoRescale|styleNoLabel|styleNoTitle ,Null,Null, LastValue(totalBars));
Plot(cdl(fr4),"DR4",colorRed,styleLine|styleNoRescale|styleNoLabel|styleNoTitle ,Null,Null, LastValue(totalBars));
Plot(cdl(fs1),"DS1",colorLime,styleLine|styleNoRescale|styleNoLabel|styleNoTitle ,Null,Null, LastValue(totalBars));
Plot(cdl(fs2),"DS2",colorLime,styleLine|styleNoRescale|styleNoLabel|styleNoTitle ,Null,Null, LastValue(totalBars));
Plot(cdl(fs3),"DS3",colorLime,styleLine|styleNoRescale|styleNoLabel|styleNoTitle ,Null,Null, LastValue(totalBars));
Plot(cdl(fs4),"DS4",colorLime,styleLine|styleNoRescale|styleNoLabel|styleNoTitle ,Null,Null, LastValue(totalBars));


//### PLOT DAILY PIVOT LINES ###//
Plot(cdl(wp),"wP",colorWhite,styleLine|styleNoRescale|styleNoLabel|styleNoTitle ,Null,Null, LastValue(totalBars));
Plot(cdl(wr1),"wR1",colorDarkRed,styleLine|styleNoRescale|styleNoLabel|styleNoTitle ,Null,Null, LastValue(totalBars));
Plot(cdl(wr2),"wR2",colorDarkRed,styleLine|styleNoRescale|styleNoLabel|styleNoTitle ,Null,Null, LastValue(totalBars));
Plot(cdl(wr3),"wR3",colorDarkRed,styleLine|styleNoRescale|styleNoLabel|styleNoTitle ,Null,Null, LastValue(totalBars));
Plot(cdl(wr4),"wR4",colorDarkRed,styleLine|styleNoRescale|styleNoLabel|styleNoTitle ,Null,Null, LastValue(totalBars));
Plot(cdl(ws1),"ws1",colorDarkGreen,styleLine|styleNoRescale|styleNoLabel|styleNoTitle ,Null,Null, LastValue(totalBars));
Plot(cdl(ws2),"ws2",colorDarkGreen,styleLine|styleNoRescale|styleNoLabel|styleNoTitle ,Null,Null, LastValue(totalBars));
Plot(cdl(ws3),"ws3",colorDarkGreen,styleLine|styleNoRescale|styleNoLabel|styleNoTitle ,Null,Null, LastValue(totalBars));
Plot(cdl(ws4),"ws4",colorDarkGreen,styleLine|styleNoRescale|styleNoLabel|styleNoTitle ,Null,Null, LastValue(totalBars));

//### PLOT DAILY PIVOT LABLES ###//
PlotTextSetFont("X", "Calibri", 8.5, LastValue(BarIndex())-(numbars/Hts), colorGreen, colorDefault, -30 );
PlotText("DP", LastValue(BarIndex())-(numbars/Hts), fpI, ColorRGB(123,123,192));
PlotText("PH", LastValue(BarIndex())-(numbars/Hts), DayHI, colorRed);
PlotText("PL", LastValue(BarIndex())-(numbars/Hts), DayLI, colorRed);
PlotText("DR1", LastValue(BarIndex())-(numbars/Hts), fr1I, colorRed);
PlotText("DR2", LastValue(BarIndex())-(numbars/Hts), fr2I, colorRed);
PlotText("DR3" , LastValue(BarIndex())-(numbars/Hts), fr3I, colorRed);
PlotText("DR4" , LastValue(BarIndex())-(numbars/Hts), fr4I, colorRed);
PlotText("DS1" , LastValue(BarIndex())-(numbars/Hts), fs1I, colorLime);
PlotText("DS2" , LastValue(BarIndex())-(numbars/Hts), fs2I, colorLime);
PlotText("DS3" , LastValue(BarIndex())-(numbars/Hts), fs3I, colorLime);
PlotText("DS4" , LastValue(BarIndex())-(numbars/Hts), fs4I, colorLime);

//### PLOT DAILY PIVOT LABLES ###//
PlotTextSetFont("X", "Calibri", 8.5, LastValue(BarIndex())-(numbars/Hts), colorGreen, colorDefault, -30 );
PlotText("wP", LastValue(BarIndex())-(numbars/Hts), wpI, colorWhite);
PlotText("wR1", LastValue(BarIndex())-(numbars/Hts), wr1I, colorDarkRed);
PlotText("wR2", LastValue(BarIndex())-(numbars/Hts), wr2I, colorDarkRed);
PlotText("wR3", LastValue(BarIndex())-(numbars/Hts), wr3I, colorDarkRed);
PlotText("wR4", LastValue(BarIndex())-(numbars/Hts), wr4I, colorDarkRed);
PlotText("ws1", LastValue(BarIndex())-(numbars/Hts), ws1I, colorDarkGreen);
PlotText("ws2", LastValue(BarIndex())-(numbars/Hts), ws2I, colorDarkGreen);
PlotText("ws3", LastValue(BarIndex())-(numbars/Hts), ws3I, colorDarkGreen);
PlotText("ws4", LastValue(BarIndex())-(numbars/Hts), ws4I, colorDarkGreen);


//PlotOHLC( fBC, fBC, fTC, fTC, "", colorBlack, styleCloud|styleNoLine|styleNoRescale|styleNoLabel);

//### PLOT DAILY PIVOT LABLES ###//

}

_SECTION_END();
8 comments
Leave Comment
Please login here to leave a comment.
To get better visibility In AB —> Tools —> Prefences —> Charting —> “Blank Bars in right margin (default):” set to 10.
Hi 1st thanks 4 grt effort Iam new 4 AFL coding i tried to copy and paste in my ami but showing Error,
Thanks about your best programming I humble a little bit help given to me how to plot an afl modifying but need trend signal button type indicator foot like 5M 10M 15M 30M HRS what’s the sentex write please help me Thanks your kind
Hi thanks 4 grt effort
skarora
It shows error on Ln 109 & 123
Error 32. Syntax error, unexpected ‘(’. Is there semicolon missing at the end of the previous line?
How to trade with this pivot?
Very helpful for trading.
hello sir, after applying this afl, get error Ln:115, col:16 error :32, unexpected error (is there semi colon missing ?) plz resolve this error. thank you