Combination for Amibroker (AFL)
morgen about 16 years ago Amibroker (AFL)
It is simply a combination of indicators-systems for more efficient buy/sell signals.
Thanks the indicators-systems authors!
Screenshots
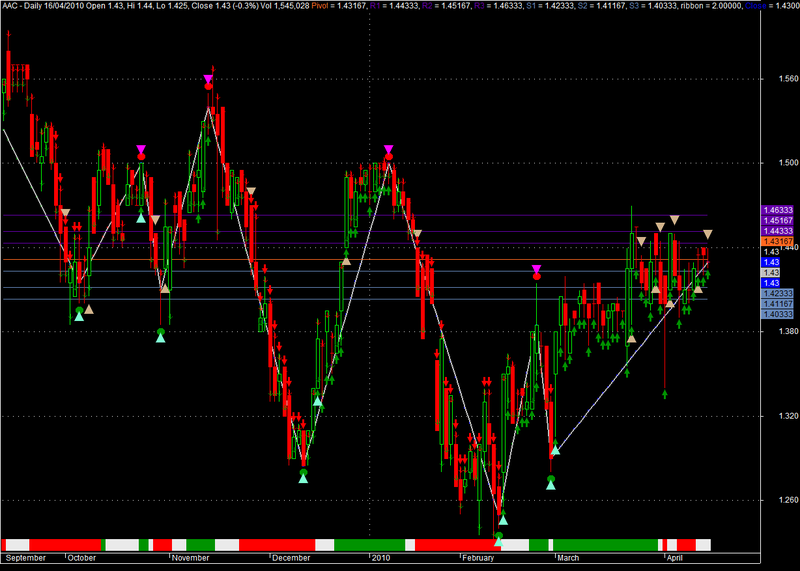
Indicator / Formula
Copy & Paste Friendly
//TOMORROW'S PIVOTS
//Description:
//I had been struggling with the code to Plot todays pivots from yesterdays price when using an intraday database.
//There were none available in the Amibroker library which plotted correctly the pivots for tomorrow on a intraday database.
//I checked the Amibroker forum AND found the following. Thank you goes to sdebu_2k. if you wish to go to the forum
//search for "plotting tomorrow pivots". This routine provides todays quotes in the Title bar AND holds the todays pivots constant
//in the Title bar as well. The plotted pivots moves to the next Day when entering into the next Day. Absolutely brilliant! Thank you.//
SetChartOptions(0,chartShowArrows|chartShowDates);
_N(Title = StrFormat("{{NAME}} - {{INTERVAL}} {{DATE}} Open %g, Hi %g, Lo %g, Close %g (%.1f%%) Vol " +WriteVal( V, 1.0 ) +"
{{VALUES}}", O, H, L, C, SelectedValue( ROC( C, 1 )) ));
Plot( C, "Close", ParamColor("Color", colorBlack ), styleNoTitle | ParamStyle("Style") | GetPriceStyle() );
H1=SelectedValue( TimeFrameGetPrice( "H", inDaily, -1 ));
L1=SelectedValue(TimeFrameGetPrice( "L", inDaily, -1 ));
C1=SelectedValue(TimeFrameGetPrice( "C", inDaily, -1 ));
/*PIVOT Calculation*/
p = ( H1+ L1 + C1 )/3;
s1 = (2*p)-H1;
r1 = (2*p)-L1;
s2 = p -(H1 - L1);
s3 = S1 - (H1-L1);
r2 = p +(H1 - L1);
r3 = R1 +(H1-L1);

Plot (p,"Pivot",25,1);
Plot (r1,"R1",12,1);
Plot (r2,"R2",12,1);
Plot (r3,"R3",12,1);
Plot (s1,"S1",3,1);
Plot (s2,"S2",3,1);
Plot (s3,"S3",3,1);
X=Cross(C,p);
Z=Cross(p,C);
PlotShapes(IIf(X,shapeUpTriangle,shapeNone),colorTan,0,Low,Offset=-20);
PlotShapes(IIf(Z,shapeDownTriangle,shapeNone),colorTan,0,High,Offset=-20);
//================================================================================================================================

//TRENDING RIBBON
// Paste the code below to your price chart somewhere and green ribbon means both
// both MACD and ADX trending up so if the red ribbon shows up the MACD and the ADX
// are both trending down.
_SECTION_BEGIN("trending ribbon");
uptrend=PDI()>MDI() AND MACD()>Signal();
downtrend=MDI()>PDI() AND Signal()>MACD();
Plot( 2, /* defines the height of the ribbon in percent of pane width */"ribbon",
IIf( uptrend, colorGreen, IIf( downtrend, colorRed, 0 )), /* choose color */
styleOwnScale|styleArea|styleNoLabel, -0.5, 100 );
_SECTION_END();
_SECTION_BEGIN("Price");
//SetChartOptions(0,chartShowArrows|chartShowDates);
//_N(Title = StrFormat("{{NAME}} - {{INTERVAL}} {{DATE}} Open %g, Hi %g, Lo %g, Close %g (%.1f%%) {{VALUES}}", O, H, L, C,
//SelectedValue( ROC( C, 1 ) ) ));
//Plot( C, "Close", ParamColor("Color", colorBlack ), styleNoTitle | ParamStyle("Style") | GetPriceStyle() );
_SECTION_END();
//===================================================================================================================================

//ZIG-ZAG INDICATOR
//z_ZigZagValid
// ******** CHARTING
PercentChange = 6;
mystartbar = SelectedValue(BarIndex());  // FOR GRAPHING
mystartbardate = LastValue(ValueWhen(mystartbar == BarIndex(), DateNum(),1));
InitialValue = LastValue(ValueWhen(mystartbardate == DateNum(), C , 1 ) ) ;
Temp1 = IIf(BarIndex() >= mystartbar, InitialValue, Null) ;
//Plot(Temp1, " ", colorBlack,styleLine);
//Plot((1+(LastValue(PercentChange)/100))*(Temp1), " ", colorGreen, styleLine) ;
//Plot((1-(LastValue(PercentChange)/100))*(Temp1), " ", colorRed, styleLine) ;
ZZ = Zig(C,LastValue(PercentChange)) ;
PivotLow = Ref(IIf(Ref(ROC(ZZ,1),-1) < 0 AND ROC(ZZ,1) > 0, 1, Null),1);
PivotHigh = Ref(IIf(Ref(ROC(ZZ,1),-1) > 0 AND ROC(ZZ,1) < 0, 1, Null),1);
PlotShapes( shapeCircle*PivotLow, colorGreen,0, L, -10) ;
PlotShapes( shapeCircle*PivotHigh,colorRed,0,H, 10) ;
Buy_Valid = IIf(C>(1+(LastValue(PercentChange)/100))*(ValueWhen(PivotLow, C, 1))
AND ROC(ZZ,1) > 0,1,0);
Sell_Valid = IIf(C<(1-(LastValue(PercentChange)/100))*(ValueWhen(PivotHigh, C, 1))
AND ROC(ZZ,1) < 0,1,0);
//Buy = ExRem(Buy_Valid,Sell_Valid);
//Sell = ExRem(Sell_Valid,Buy_Valid);
//Buy=PivotLow OR
   // ExRem(Buy_Valid,Sell_Valid) AND StochK()>StochD() AND StochK()<80 AND ADX()<40 AND C>O ;
//Sell=ExRem(Sell_Valid,Buy_Valid) OR
     //Cross(80,StochK()) AND StochD()>StochK() OR
     //Cross(Signal(),MACD()) ;
PlotShapes( shapeUpArrow*Buy_Valid, colorGreen,0, L, -10);
PlotShapes( shapeDownArrow*Sell_Valid, colorRed,0,H, -10) ;
//PlotShapes(IIf(Buy,shapeUpTriangle,shapeNone),colorAqua,0,Low,Offset=-30);
//PlotShapes(IIf(Sell,shapeDownTriangle,shapeNone),colorCustom12,0,High,Offset=-30);
BarColors =
IIf(BarsSince(Buy_Valid) < BarsSince(Sell_Valid)
AND BarsSince(Buy_Valid)!=0, colorGreen,
IIf(BarsSince(Sell_Valid) < BarsSince(Buy_Valid)
AND BarsSince(Sell_Valid)!=0,  colorRed, colorBlue));
//Plot(C, " ", BarColors,  styleCandle ) ;
_SECTION_BEGIN("Price");
SetChartOptions(0,chartShowArrows|chartShowDates);
_N(Title = StrFormat("{{NAME}} - {{INTERVAL}} {{DATE}} Open %g, Hi %g, Lo %g, Close %g (%.1f%%) Vol " +WriteVal( V, 1.0 ) +" {{VALUES}}", O, H, L, C, SelectedValue( ROC( C, 1 )) ));
Plot( C, "Close", BarColors,styleCandle, styleNoTitle | ParamStyle("Style") | GetPriceStyle() );
if( ParamToggle("Tooltip shows", "All Values|Only Prices" ) )
{
ToolTip=StrFormat("Open: %g\nHigh: %g\nLow: %g\nClose: %g (%.1f%%)\nVolume: "+NumToStr( V, 1 ), O, H, L, C, SelectedValue( ROC( C, 1 )));
}
_SECTION_END();
Plot(ZZ," ", colorLightGrey,styleLine|styleThick);
Plot(ZZ," ", BarColors,styleDots|styleNoLine);
//Title = Name() + " " + Date() + WriteIf(PivotLow, " Up Pivot ","")+WriteIf(PivotHigh," Down Pivot ","")+ WriteIf(Buy_Valid, " Buy Point ", "") + WriteIf(Sell_Valid, " Sell Point ", "") ;
//========================================================================================================================================

zzup=ZZ>Ref(ZZ,-1) ;

Buy=PivotLow OR
    ExRem(Buy_Valid,Sell_Valid) AND zzup ;
Sell=PivotHigh ;

PlotShapes(IIf(Buy,shapeUpTriangle,shapeNone),colorAqua,0,Low,Offset=-20);
PlotShapes(IIf(Sell,shapeDownTriangle,shapeNone),colorCustom12,0,High,Offset=-20);
1 comments
Leave Comment
Please login here to leave a comment.
errors